Fig. 8
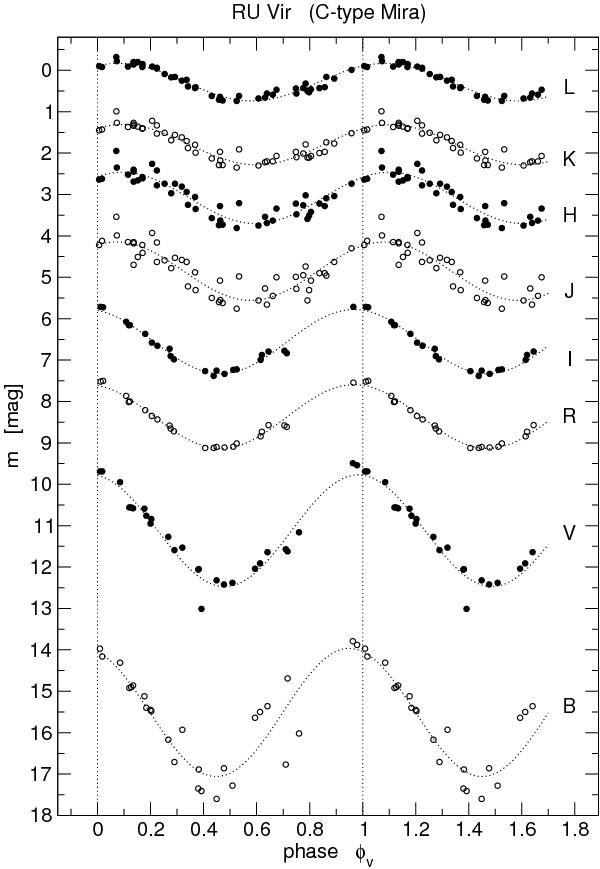
Observed light variations of RU Vir (cf. Sect. 3) in different filters as labelled on the right hand side. The data were adopted from Eggen (1975a; BVRI) and Whitelock et al. (2006; JHKL), respectively. Measurements from different periods are merged into a combined light cycle, each data point is then plotted twice to highlight the periodic variations. Sinusoidal fits (one Fourier component, see text for details) are overplotted with dotted lines to guide the eye. An analogous plot for an M-type Mira, namely RR Sco, can be found in Lattanzio & Wood (2004; their Fig. 2.44).
Current usage metrics show cumulative count of Article Views (full-text article views including HTML views, PDF and ePub downloads, according to the available data) and Abstracts Views on Vision4Press platform.
Data correspond to usage on the plateform after 2015. The current usage metrics is available 48-96 hours after online publication and is updated daily on week days.
Initial download of the metrics may take a while.