Fig. 3
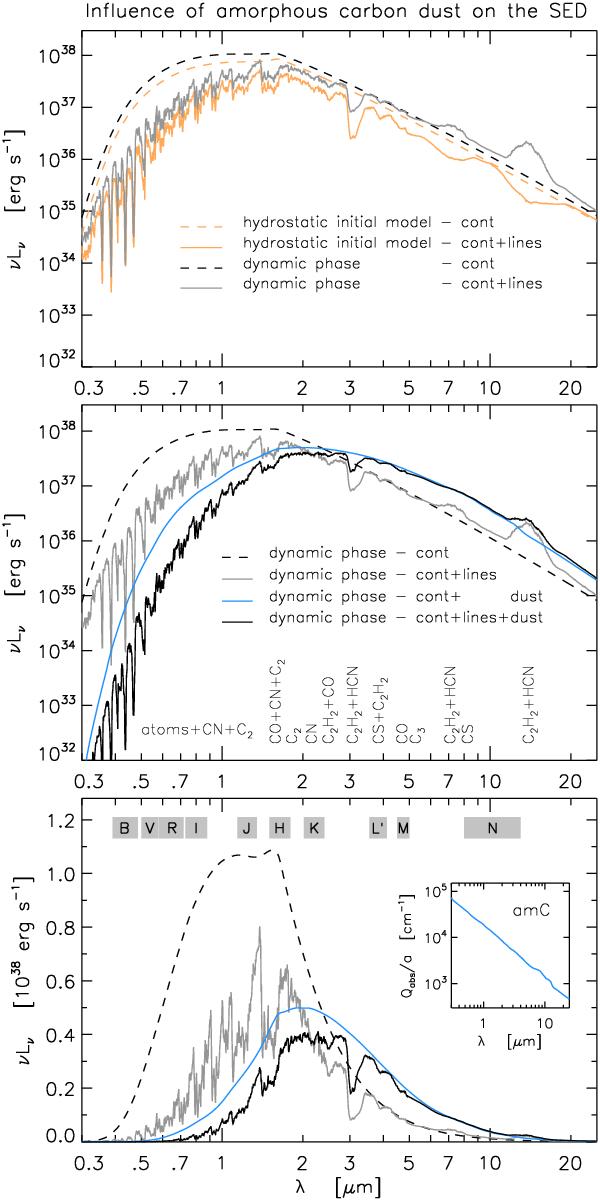
Illustration of the influence of different opacity sources (for details see text) – especially the grains of amorphous carbon dust – on the resulting spectra demonstrated with the help of the dust-free initial model and one phase of the dynamic calculation (φbol = 0.0) of model S. Different sources were included in the a posteriori RT as denoted in the legend. In the middle panel the molecular species responsible for the major features are indicated. In the bottom panel (showing the same as the middle panel but scaled linearly) the wavelength ranges of the used broad-band filters ( ≈ FWHM of the responses given in Bessell 1990; and Bessell & Brett 1988) are marked for orientation purposes, while the insert shows the absorption data for amorphous carbon dust from Rouleau & Martin (1991) as applied for the computations.
Current usage metrics show cumulative count of Article Views (full-text article views including HTML views, PDF and ePub downloads, according to the available data) and Abstracts Views on Vision4Press platform.
Data correspond to usage on the plateform after 2015. The current usage metrics is available 48-96 hours after online publication and is updated daily on week days.
Initial download of the metrics may take a while.