Fig. B.1
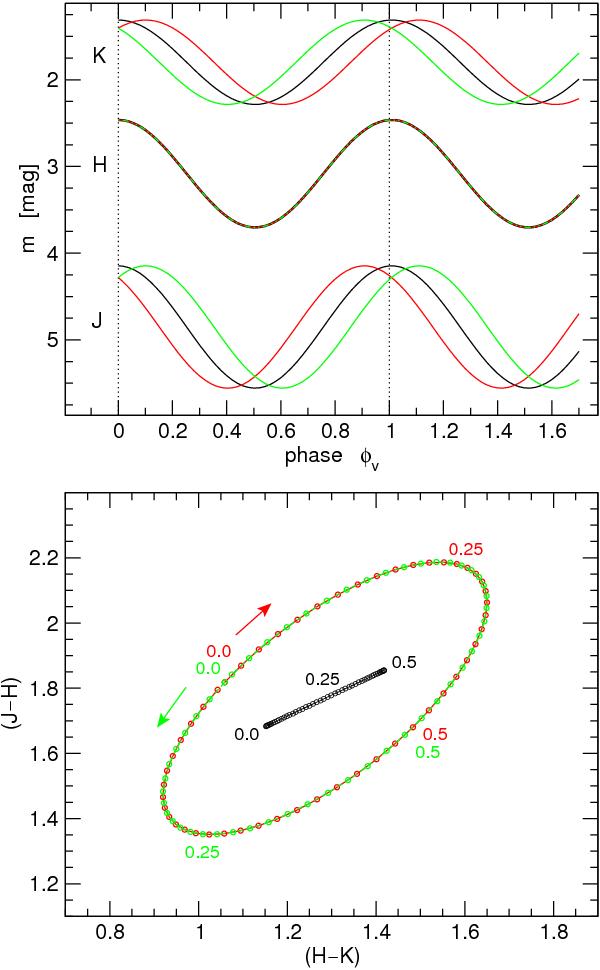
Upper panel: simulated JHK lightcurves adopted from Fig. 8 (sinusoidal fits to the observational data there) with artificial phase shifts of Δφ = −0.1/0/+0.1 (red, black, and green lines, respectively) imposed in all three filters. Lower panel: resulting variations in an NIR colour − colour diagram, colour coded correspondingly. The labels mark locations occupied by the object at certain phases φv, while the arrows designate the sense of rotation of the loops.
Current usage metrics show cumulative count of Article Views (full-text article views including HTML views, PDF and ePub downloads, according to the available data) and Abstracts Views on Vision4Press platform.
Data correspond to usage on the plateform after 2015. The current usage metrics is available 48-96 hours after online publication and is updated daily on week days.
Initial download of the metrics may take a while.