Fig. A.2
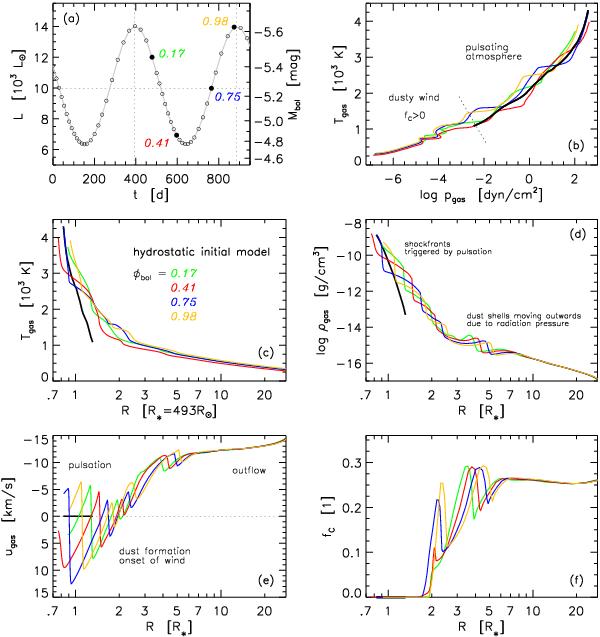
Characteristic properties of model S. Plotted in panel a) is the bolometric lightcurve resulting from the variable inner boundary (piston), the circles mark instances of time for which snapshots of the atmospheric structure were stored by the radiation-hydrodynamics code, partly labelled with the corresponding values for phase φbol. The dotted vertical lines mark the points in time of φbol = 0.0 and 1.0, respectively, while the horizontal line marks L ⋆ of the initial model which is almost equal to ⟨ L ⟩ of the dynamical calculation (NHA10). The other panels show the atmospheric structures of the initial hydrostatic model (thick black line) together with selected phases φbol of the dynamic calculation during one pulsation cycle (colour-coded in the same way as the phase labels of panel a)). While panel b) shows the classical plot of gas temperature vs. gas pressure used to characterise stellar atmospheres, the middle and lower panels illustrate the radial structures of gas temperatures c), gas densities d), gas velocities e), and condensation degrees of the element carbon into amorphous carbon dust grains f).
Current usage metrics show cumulative count of Article Views (full-text article views including HTML views, PDF and ePub downloads, according to the available data) and Abstracts Views on Vision4Press platform.
Data correspond to usage on the plateform after 2015. The current usage metrics is available 48-96 hours after online publication and is updated daily on week days.
Initial download of the metrics may take a while.