Fig. 16
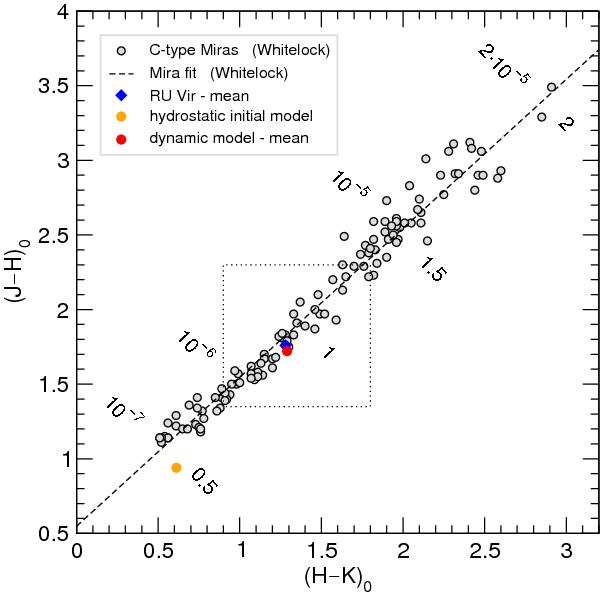
Mean colours corrected for interstellar reddening as listed in Table 6 of Whitelock et al. (2006) for all C-type Miras (i.e., their class 1n). The dashed line represents the fit given in Eq. (2) of Whitelock et al. (2006) for the de-reddened Mira sample. The labels along the sequence mark approximate mass loss rates Ṁ [M⊙ yr-1] (above the fit line) as well as photometric amplitudes ΔK [mag] (below) corresponding to given colours as derived by Whitelock et al. Overplotted are the synthetic colours of model S (initial model as well as the average of several phases of the various cycles in Fig. 13) for comparison. The box drawn with dotted lines marks the range covered in Figs. 13 and 14.
Current usage metrics show cumulative count of Article Views (full-text article views including HTML views, PDF and ePub downloads, according to the available data) and Abstracts Views on Vision4Press platform.
Data correspond to usage on the plateform after 2015. The current usage metrics is available 48-96 hours after online publication and is updated daily on week days.
Initial download of the metrics may take a while.