Fig. 15
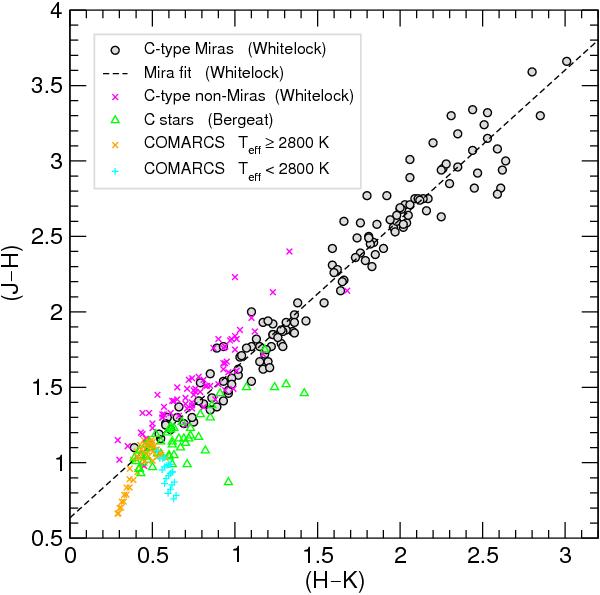
Mean colours (no correction for interstellar reddening) for C stars derived from the Fourier-mean JHK magnitudes listed in Table 3 of Whitelock et al. (2006) for all Miras (i.e., their variability type 1n) and all non-Miras (i.e., their class 2n). Each point represents the time average of temporal variations (as shown in Fig. 14 for a subsample of the targets included here) for a specific object. The dashed line represents the fit given in Eq. (7) of Whitelock et al. (2006) for the Mira sample prior to de-reddening. In addition, the photometric data collected by Bergeat et al. (2001; Table 4) is overplotted as well as synthetic colours from a sub-grid of the hydrostatic COMARCS models presented in Paper I for comparison.
Current usage metrics show cumulative count of Article Views (full-text article views including HTML views, PDF and ePub downloads, according to the available data) and Abstracts Views on Vision4Press platform.
Data correspond to usage on the plateform after 2015. The current usage metrics is available 48-96 hours after online publication and is updated daily on week days.
Initial download of the metrics may take a while.