Fig. 12
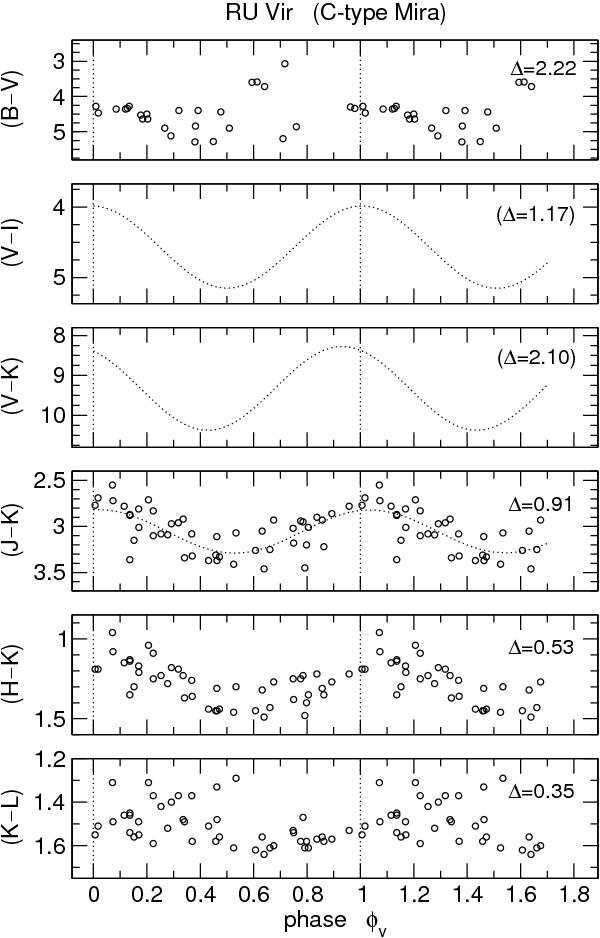
Variations of different colour indices of RU Vir. The dotted curves were derived from the sinusoidal fits in Fig. 8 as no simultaneous measurements of the individual magnitudes are available for (V − I) and (V − K). To get an idea of how representative these estimates are the same simulated colour curve was derived for (J − K), where photometry at the same epochs is available as well. On the right hand side the amplitudes of the respective colour indices are listed (in brackets if only derived from the simulated variations).
Current usage metrics show cumulative count of Article Views (full-text article views including HTML views, PDF and ePub downloads, according to the available data) and Abstracts Views on Vision4Press platform.
Data correspond to usage on the plateform after 2015. The current usage metrics is available 48-96 hours after online publication and is updated daily on week days.
Initial download of the metrics may take a while.