Fig. 11
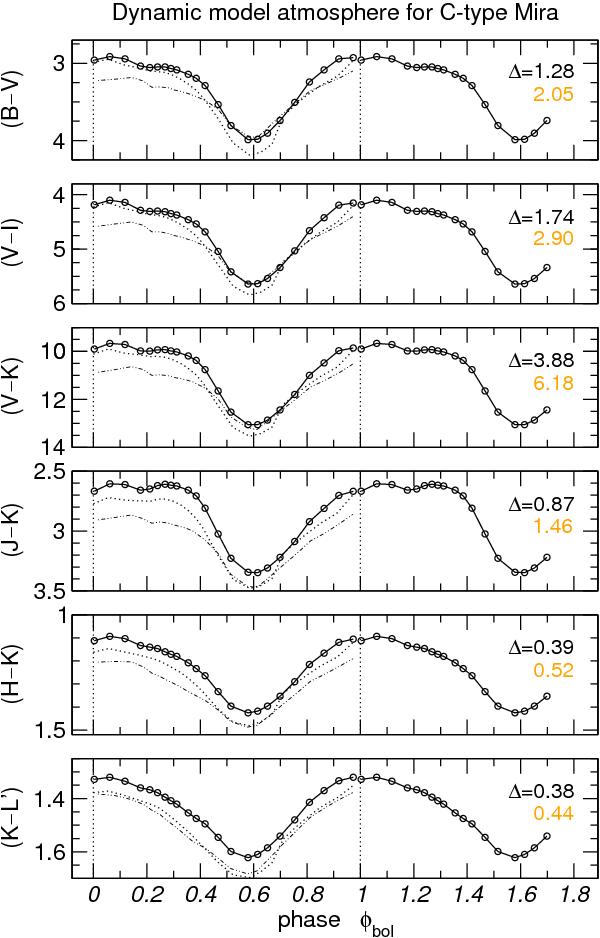
Variations of different colour indices for model S, overplotted with the same linestyles as in Fig. 7 are the values for different pulsation cycles. On the right hand side the amplitudes in the colour indices are listed as well as the corresponding colours of the hydrostatic initial model for comparison. Same colour code as in Fig. 3.
Current usage metrics show cumulative count of Article Views (full-text article views including HTML views, PDF and ePub downloads, according to the available data) and Abstracts Views on Vision4Press platform.
Data correspond to usage on the plateform after 2015. The current usage metrics is available 48-96 hours after online publication and is updated daily on week days.
Initial download of the metrics may take a while.