Fig. 10
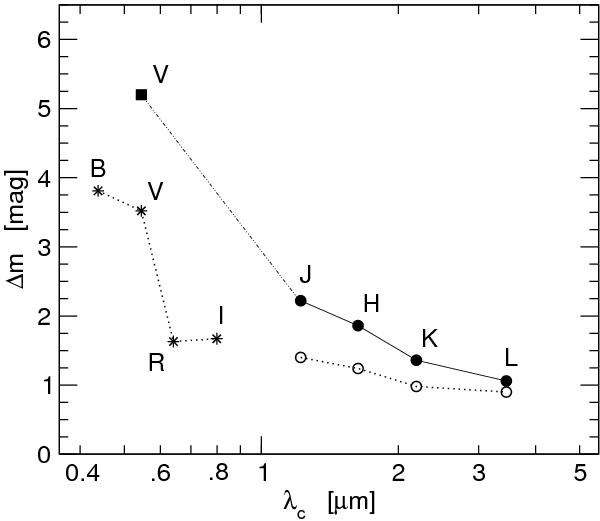
Amplitudes of the observed light variations of RU Vir as shown in Fig. 8. For the JHKL filters the total amplitudes (mmax − mmin) of the data sample from Whitelock et al. (2006) are plotted with filled circles, together with the amplitude of the Fourier fit given by Whitelock et al. in their Table 3 plotted with open circles. For the BVRI filters only the first kind of amplitude is available and plotted with asterisks. In addition, the GCVS value for ΔV is shown with a filled square. The discrepancy in V is due to the limited sampling of the data obtained by Eggen (1975a).
Current usage metrics show cumulative count of Article Views (full-text article views including HTML views, PDF and ePub downloads, according to the available data) and Abstracts Views on Vision4Press platform.
Data correspond to usage on the plateform after 2015. The current usage metrics is available 48-96 hours after online publication and is updated daily on week days.
Initial download of the metrics may take a while.