Fig. 1
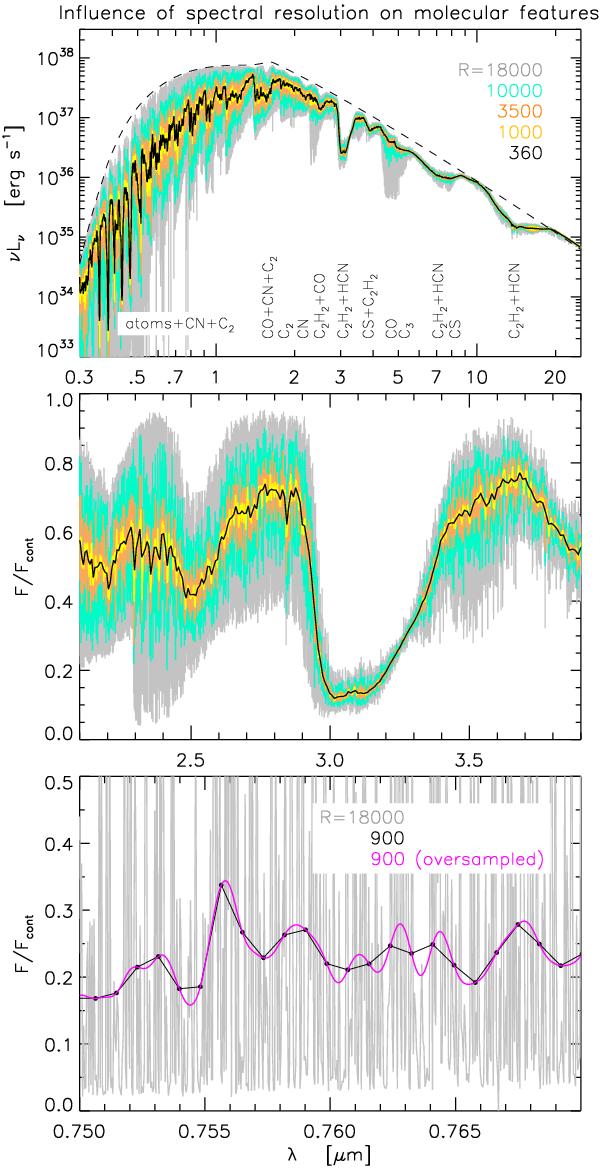
Synthetic spectrum based on the hydrostatic and dust-free initial model (R = 18 000, grey) calculated as described in Sect. 2.2, and some spectra of lower resolutions (as given in the legend) to illustrate the effect of the rebinning on the appearance of the molecular features. In the top panel, the whole spectral range is shown, while the middle panel show the details of a smaller sections. The dashed line marks a calculation where all line contributions were neglected (theoretical continuum level). The bottom panel shows the difference for a spectrum of lower resolution if oversampled by a factor of 10 (magenta) or not (black).
Current usage metrics show cumulative count of Article Views (full-text article views including HTML views, PDF and ePub downloads, according to the available data) and Abstracts Views on Vision4Press platform.
Data correspond to usage on the plateform after 2015. The current usage metrics is available 48-96 hours after online publication and is updated daily on week days.
Initial download of the metrics may take a while.