Fig. 2
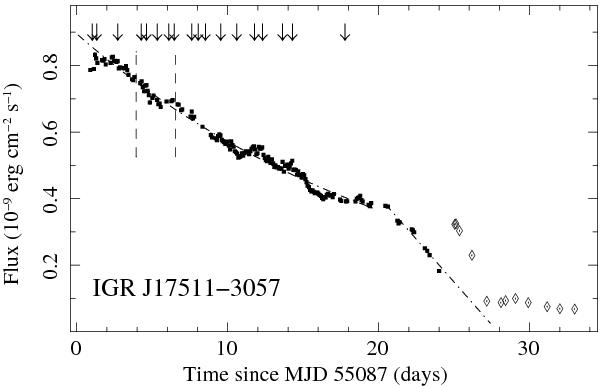
RXTE/PCA (2–20 keV) outburst light curve of IGR J17511–3057. For plotting purpose we chose a bin time of 6840 s. The count rate was converted into flux using the spectral results reported in Sect. 4.2. The diamonds correspond to observations in which both XTE J1751–305 and IGR J17511–3057 were active and the instruments on-board RXTE were unable to separate the contribution of the two sources. The arrows indicate the times of the detected X-ray bursts (see Sect. 6 and Table 3). The vertical dashed lines indicate the interval of the INTEGRAL observations. The dot-dashed lines correspond to the best-fit exponential profile, F ∝ e − t/22.4d, and a linear decay.
Current usage metrics show cumulative count of Article Views (full-text article views including HTML views, PDF and ePub downloads, according to the available data) and Abstracts Views on Vision4Press platform.
Data correspond to usage on the plateform after 2015. The current usage metrics is available 48-96 hours after online publication and is updated daily on week days.
Initial download of the metrics may take a while.