Free Access
Fig. 10
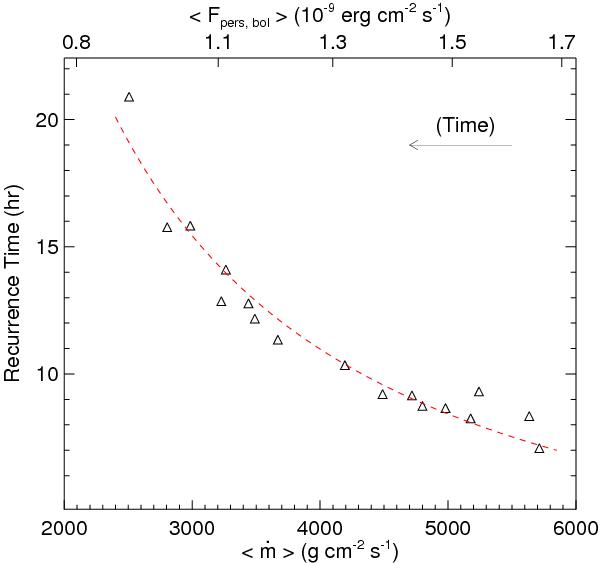
Triangles in the figure represent the observed burst recurrence times (see Table 3) shown as a function of local mass accretion rate (the corresponding flux is reported in the upper x-axis). We also show the best-fit power-law model. The recurrence time increased with time roughly as ⟨ Fpers,bol ⟩ -1.1.
Current usage metrics show cumulative count of Article Views (full-text article views including HTML views, PDF and ePub downloads, according to the available data) and Abstracts Views on Vision4Press platform.
Data correspond to usage on the plateform after 2015. The current usage metrics is available 48-96 hours after online publication and is updated daily on week days.
Initial download of the metrics may take a while.