Free Access
Fig. 7
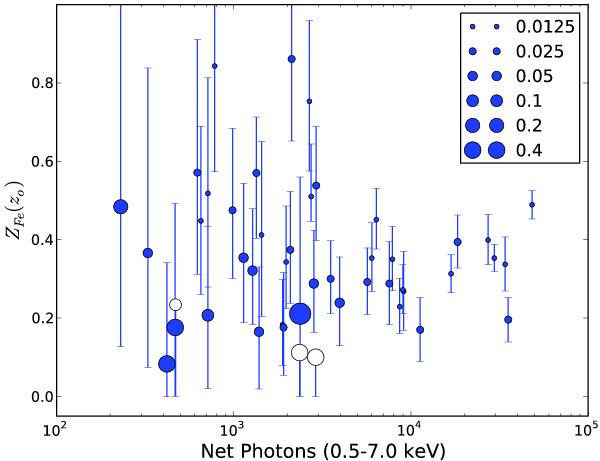
“True” Fe abundance (obtained by fitting the X-ray spectra freezing the redshift to the optical value) versus the total number of detected photons. The radius of the dots is proportional to |Δz|. The three empty circles represent 1σ upper limits.
Current usage metrics show cumulative count of Article Views (full-text article views including HTML views, PDF and ePub downloads, according to the available data) and Abstracts Views on Vision4Press platform.
Data correspond to usage on the plateform after 2015. The current usage metrics is available 48-96 hours after online publication and is updated daily on week days.
Initial download of the metrics may take a while.