Fig. 13
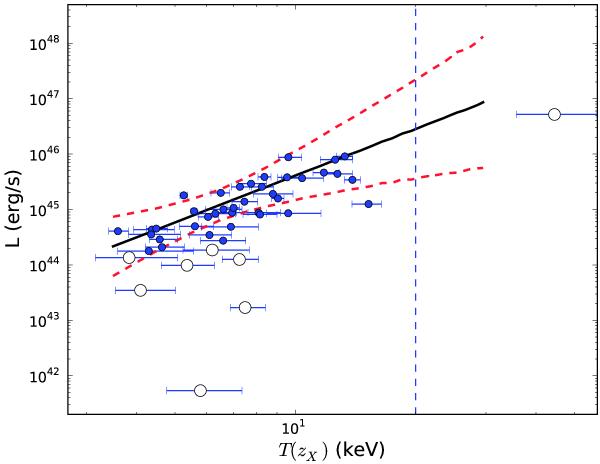
L − T relation for our cluster sample compared with the relation measured by Maughan et al. (2006). Catastrophic failures are marked as empty circles. The red dashed lines indicate the 3σ confidence levels around the average L − T relation. The vertical dashed line marks a reasonable upper limit (20 keV) that can be assumed for ICM temperatures.
Current usage metrics show cumulative count of Article Views (full-text article views including HTML views, PDF and ePub downloads, according to the available data) and Abstracts Views on Vision4Press platform.
Data correspond to usage on the plateform after 2015. The current usage metrics is available 48-96 hours after online publication and is updated daily on week days.
Initial download of the metrics may take a while.