Free Access
Fig. 7
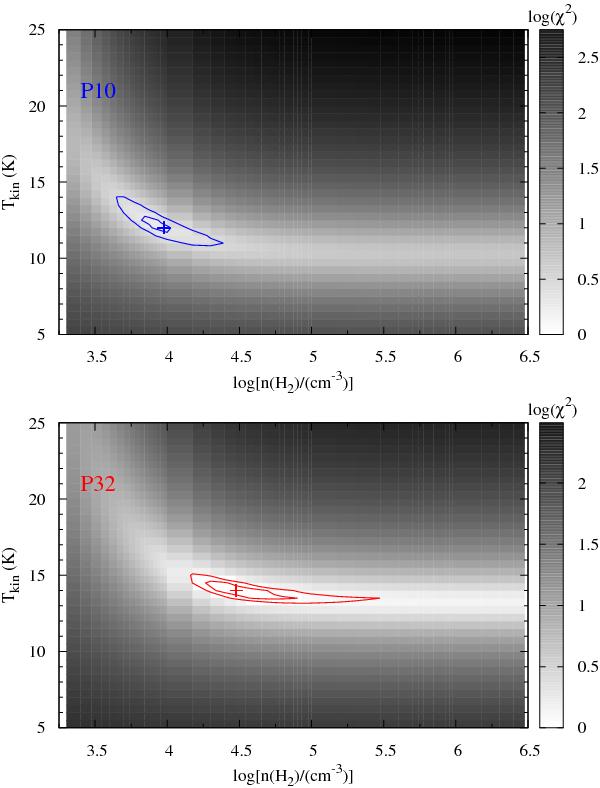
Distributions of log (χ2) in the [Tkin, n(H2)]-plane for the 4 measurements at P10 (top) and P32 (bottom) and 12CO column density of log N = 16.25. The blue contours are drawn for χ2 = 1.8 and 2.5, while the red contours mark χ2 = 1.0 and 1.2. The pluses indicate the minima.
This figure is made of several images, please see below:
Current usage metrics show cumulative count of Article Views (full-text article views including HTML views, PDF and ePub downloads, according to the available data) and Abstracts Views on Vision4Press platform.
Data correspond to usage on the plateform after 2015. The current usage metrics is available 48-96 hours after online publication and is updated daily on week days.
Initial download of the metrics may take a while.