Fig. 6
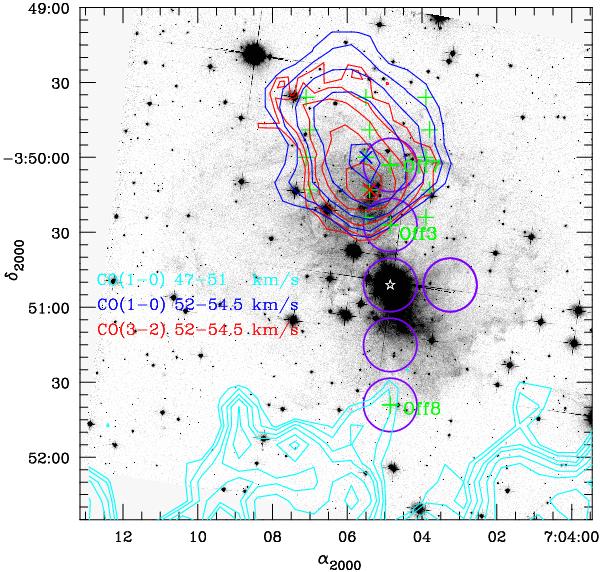
Contours of 12CO emission overplotted on the light echo image from HST (obtained in Sep. 2006, filter F814W). The blue contours show the 12CO(1–0) emission integrated in the velocity range of 52–54.5 km s-1 (0.99, 1.35, 2.01, 3.26, and 5.66 K km s-1), while cyan contours correspond to 12CO emission integrated in the range 47–51 km s-1 (1.19, 1.34, 1.57, 1.75, 2.07, 2.40, and 2.87 K km s-1). The red contours show emission in the 12CO(3–2) line integrated over 52–54.5 km s-1 (0.31, 0.51, 1.07, 2.10, and 3.88 K km s-1). The position of V838 Mon is indicated by the star. The green “+” symbols mark positions with detected emission in the 12CO(2–1) line in the IRAM single position observations (Off3, Off7, and Off8, as in Kamiński 2008). The “ × ” symbols mark positions with the strongest emission from the 12CO(1–0) line (blue, P10) and 12CO(3–2) line (red, P32) integrated in the 52–54.5 km s-1 range.
Current usage metrics show cumulative count of Article Views (full-text article views including HTML views, PDF and ePub downloads, according to the available data) and Abstracts Views on Vision4Press platform.
Data correspond to usage on the plateform after 2015. The current usage metrics is available 48-96 hours after online publication and is updated daily on week days.
Initial download of the metrics may take a while.