Free Access
Fig. 4
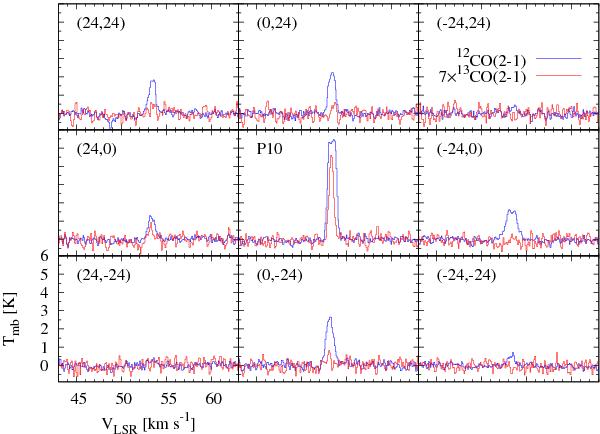
Spectra acquired using the HERA array in Jan. 2009 with P10 as the central position. Spectra obtained in 12CO(2–1) are presented with a blue line, and those for 13CO(2–1) are shown with red line. The offsets of the observed positions are indicated in the left upper corner of each panel and are given with respect to P10.
Current usage metrics show cumulative count of Article Views (full-text article views including HTML views, PDF and ePub downloads, according to the available data) and Abstracts Views on Vision4Press platform.
Data correspond to usage on the plateform after 2015. The current usage metrics is available 48-96 hours after online publication and is updated daily on week days.
Initial download of the metrics may take a while.