Fig. 3
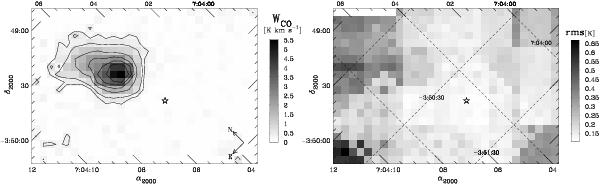
Left: integrated intensity map of the CO(3–2) emission in the range 52–54.5 km s-1, as observed with HARP/JCMT. Contours are at 5, 10, 25, 40, 55, and 70% of the peak emission. Right: the corresponding rms map, where rms is given per 0.1 km s-1 bin. Dashed lines are drawn for constant declination and right ascension. Note that the frames are not aligned with the axis of the equatorial system.
Current usage metrics show cumulative count of Article Views (full-text article views including HTML views, PDF and ePub downloads, according to the available data) and Abstracts Views on Vision4Press platform.
Data correspond to usage on the plateform after 2015. The current usage metrics is available 48-96 hours after online publication and is updated daily on week days.
Initial download of the metrics may take a while.