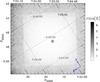
Fig. 2
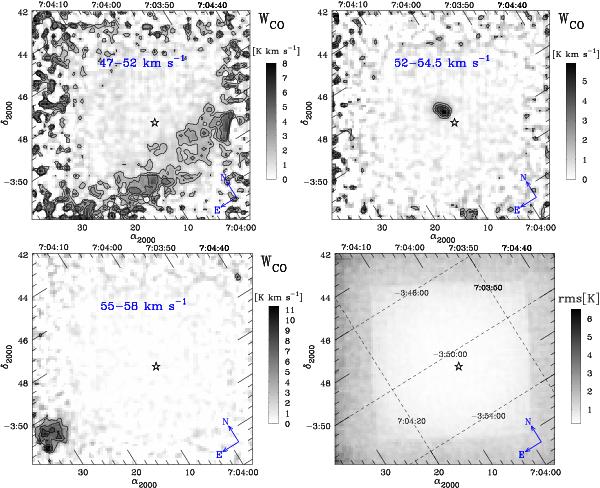
Upper left and right and lower left: integrated intensity maps in the 12CO(1–0) line obtained with the BEARS instrument at the NRO 45-m telescope. The signal was integrated in the velocity range indicated on each map. Contours are drawn for 30, 45, and 60% of the maximal integrated signal. Lower right: the noise-level distribution in the 12CO(1–0) data cube (rms values are given per 0.1 km s-1 bin). Dashed lines are drawn for constant declination and right ascension. Note that the frames are not aligned with the axis of the equatorial system. The star marks the position of V838 Mon.
Current usage metrics show cumulative count of Article Views (full-text article views including HTML views, PDF and ePub downloads, according to the available data) and Abstracts Views on Vision4Press platform.
Data correspond to usage on the plateform after 2015. The current usage metrics is available 48-96 hours after online publication and is updated daily on week days.
Initial download of the metrics may take a while.