Fig. 1
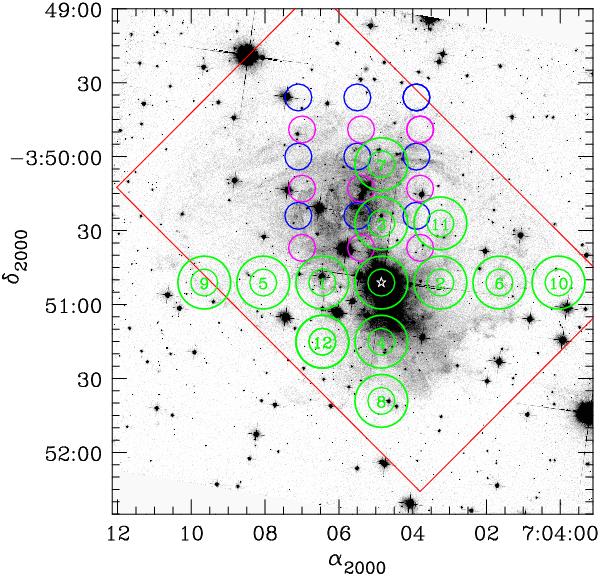
Selected regions observed in CO lines are shown on top of the optical image of the light echo. The red frame shows the main region covered by the CO(3–2) map obtained with HARP/JCMT in 2008 January. The green circles represent positions observed with the single-pixel receivers on the IRAM 30-m telescope in 2006 September. These positions are labelled with numbers introduced in Kamiński (2008). The sizes of the circles correspond to beam sizes (HPBW) at the observed frequencies, i.e. the larger ones represent the CO(1–0) data, the smaller ones represent the CO(2–1) data. The blue and magenta circles correspond to HERA observation obtained with the IRAM 30-m telescope in the CO(2–1) line in Jan. 2009. The blue and magenta colours correspond to observations with the array centerd at positions P10 and P32, respectively. The position of V838 Mon is indicated with a star. The background image was obtained with HST/ACS in the F814W filter on 2006 September 10.
Current usage metrics show cumulative count of Article Views (full-text article views including HTML views, PDF and ePub downloads, according to the available data) and Abstracts Views on Vision4Press platform.
Data correspond to usage on the plateform after 2015. The current usage metrics is available 48-96 hours after online publication and is updated daily on week days.
Initial download of the metrics may take a while.