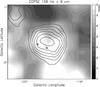
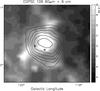
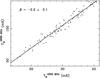
Fig. 9
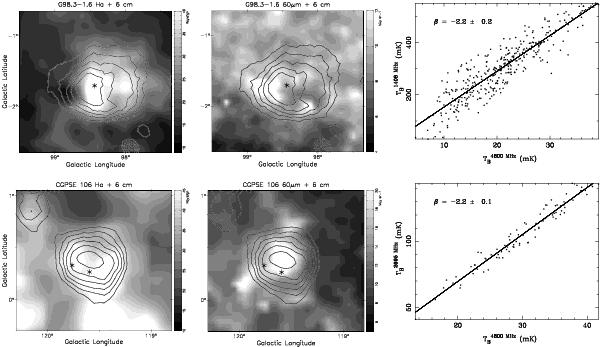
Two newly identified extended H ii regions: G98.3 − 1.6 (upper panels) and CGPSE 106 (lower panels). Total intensity contour maps at λ6 cm were overlaid onto corresponding Hα images (left panels, Finkbeiner 2003) and infrared (60 μm) images (middle panels, Miville-Deschênes & Lagache 2005). Contours of total intensity at λ6 cm start from 5 mK TB and run in steps of 5 mK TB. The B-stars in the fields were marked by stars. TT-plots of the λ6 cm data and and lower frequency Effelsberg survey data (right panels) were used to obtain spectral indices.
Current usage metrics show cumulative count of Article Views (full-text article views including HTML views, PDF and ePub downloads, according to the available data) and Abstracts Views on Vision4Press platform.
Data correspond to usage on the plateform after 2015. The current usage metrics is available 48-96 hours after online publication and is updated daily on week days.
Initial download of the metrics may take a while.