Fig. 7
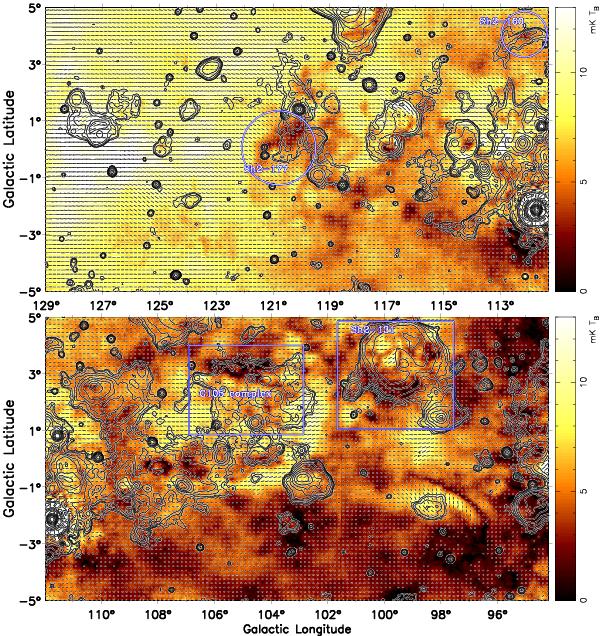
Zero-level restored PI maps for the region of 94° ≤ l ≤ 129°. The superimposed bars are separated by 9′ and are shown in the B-vector direction with lengths proportional to PI and a lower intensity cutoff of 2.5 mK TB (5 × σPI). Contours show total intensities running from 6.0 mK TB, in steps of 3.6 × 2n mK TB (n = 0, 1, 2, ...). Boxes mark strong depolarization along the periphery of the H ii regions, Sh2-131 and the G105 complex. Circles mark the depolarization H ii regions, Sh2-177 and Sh2-160.
Current usage metrics show cumulative count of Article Views (full-text article views including HTML views, PDF and ePub downloads, according to the available data) and Abstracts Views on Vision4Press platform.
Data correspond to usage on the plateform after 2015. The current usage metrics is available 48-96 hours after online publication and is updated daily on week days.
Initial download of the metrics may take a while.