Free Access
Fig. 5
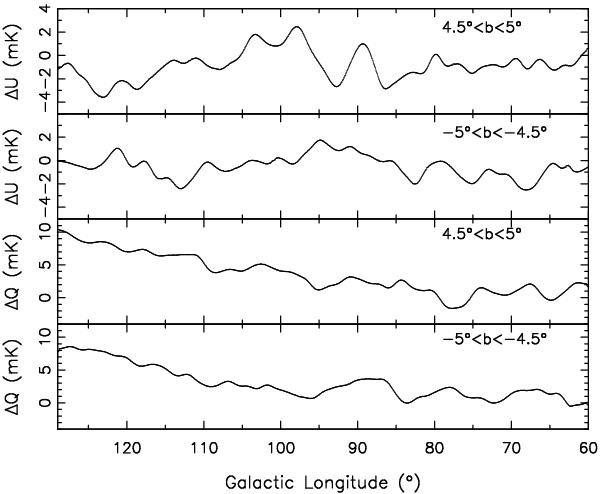
Difference between the U and Q maps at λ6 cm extrapolated from the WMAP five-year K-band at 22.8 GHz and the observed U and Q maps at λ6 cm for the high latitude areas.
Current usage metrics show cumulative count of Article Views (full-text article views including HTML views, PDF and ePub downloads, according to the available data) and Abstracts Views on Vision4Press platform.
Data correspond to usage on the plateform after 2015. The current usage metrics is available 48-96 hours after online publication and is updated daily on week days.
Initial download of the metrics may take a while.