Free Access
Fig. 11
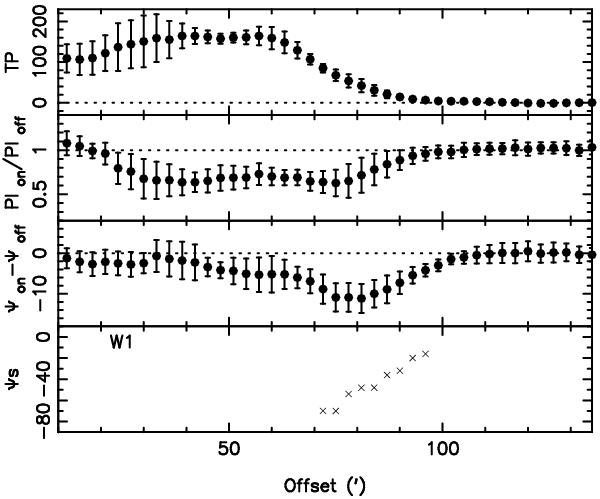
The averaged radial distributions of the total power (TP, top), PI ratio (upper middle), and the PA (lower middle) difference in the sector region of W1 defined in Fig. 10. The calculated rotation angle ψs caused by the Faraday screen is also shown (bottom).
Current usage metrics show cumulative count of Article Views (full-text article views including HTML views, PDF and ePub downloads, according to the available data) and Abstracts Views on Vision4Press platform.
Data correspond to usage on the plateform after 2015. The current usage metrics is available 48-96 hours after online publication and is updated daily on week days.
Initial download of the metrics may take a while.