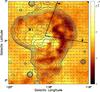
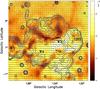
Fig. 10
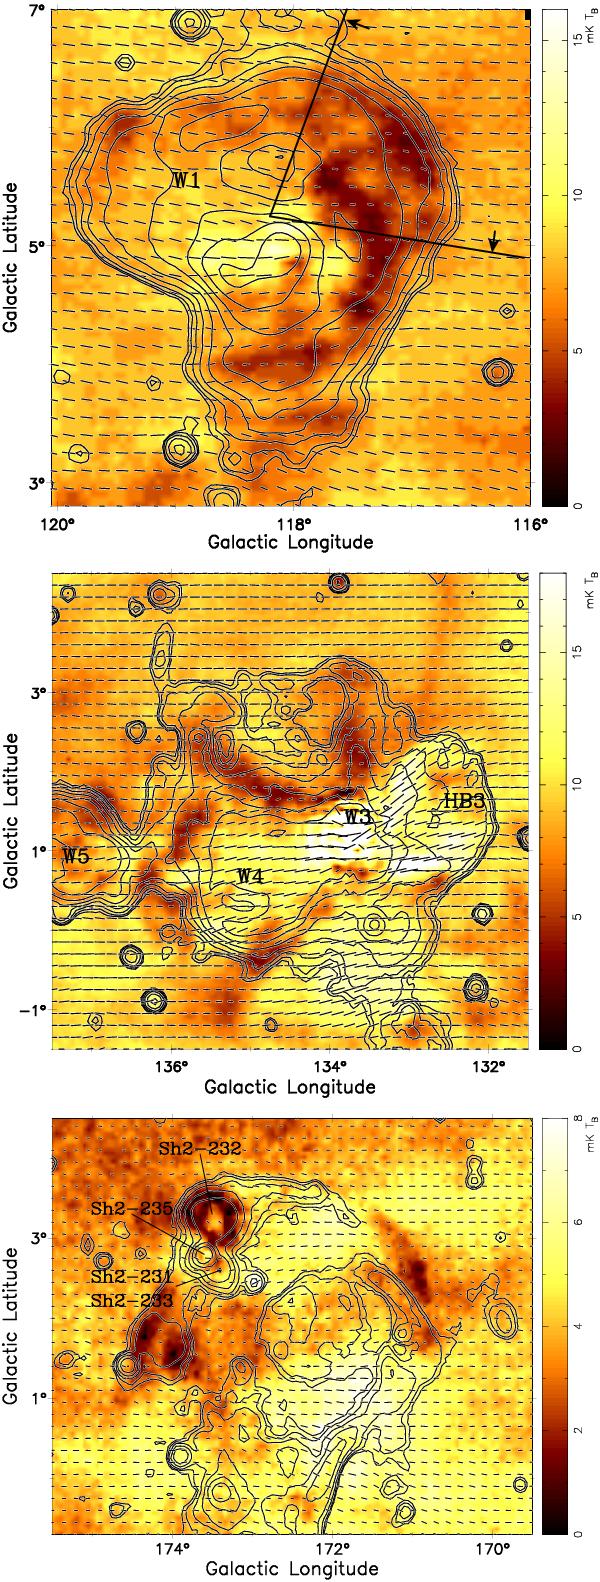
As Fig. 8 but for W1 (top), W3/W4/W5 (middle) and the G173 complex (bottom) published in Paper II showing depolarization along the periphery of H ii complexes. Depolarization of the indicated sector (position angles between − 16° and − 97°) in the outer periphery of W1 is modeled in Sect. 3.4. Total intensity contours of the W1, W3/W4/W5 and G173 complex start at 6.0, 6.0, and 3.0 mK TB, respectively, and increase in steps of 2n × 3.6 mK TB, with n = 0,1,2,...
Current usage metrics show cumulative count of Article Views (full-text article views including HTML views, PDF and ePub downloads, according to the available data) and Abstracts Views on Vision4Press platform.
Data correspond to usage on the plateform after 2015. The current usage metrics is available 48-96 hours after online publication and is updated daily on week days.
Initial download of the metrics may take a while.