Fig. 14
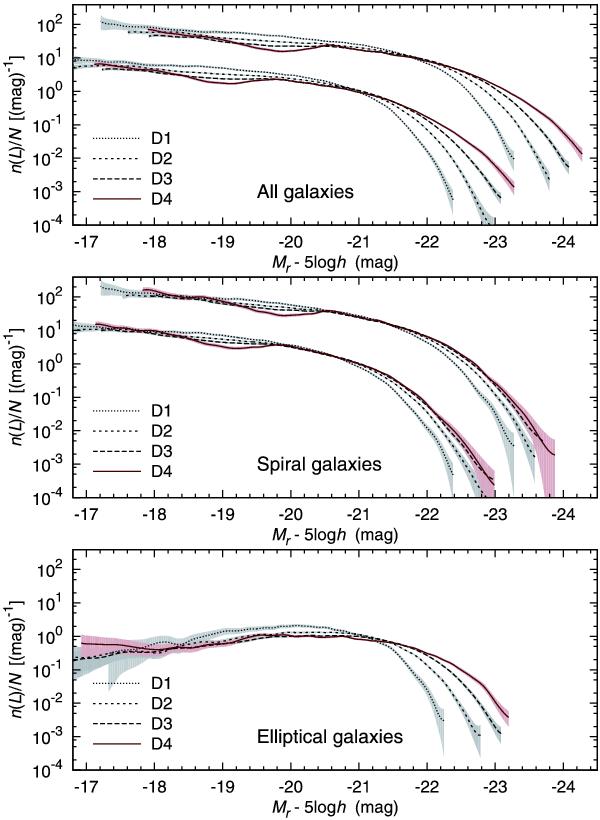
LFs for different types of galaxies in different environments. The upper LFs in each panel are the observed LFs that are shifted up two units in logarithmic scale and right by one mag. The lower LFs in each panel are the attenuation-corrected LFs. For elliptical galaxies (bottom panel), only the observed LFs are shown. Dotted lines stand for the least dense (void) environments; red solid lines stand for the most dense (supercluster) environments. The filled areas show the 95% confidence regions of the LFs.
Current usage metrics show cumulative count of Article Views (full-text article views including HTML views, PDF and ePub downloads, according to the available data) and Abstracts Views on Vision4Press platform.
Data correspond to usage on the plateform after 2015. The current usage metrics is available 48-96 hours after online publication and is updated daily on week days.
Initial download of the metrics may take a while.