Fig. 3
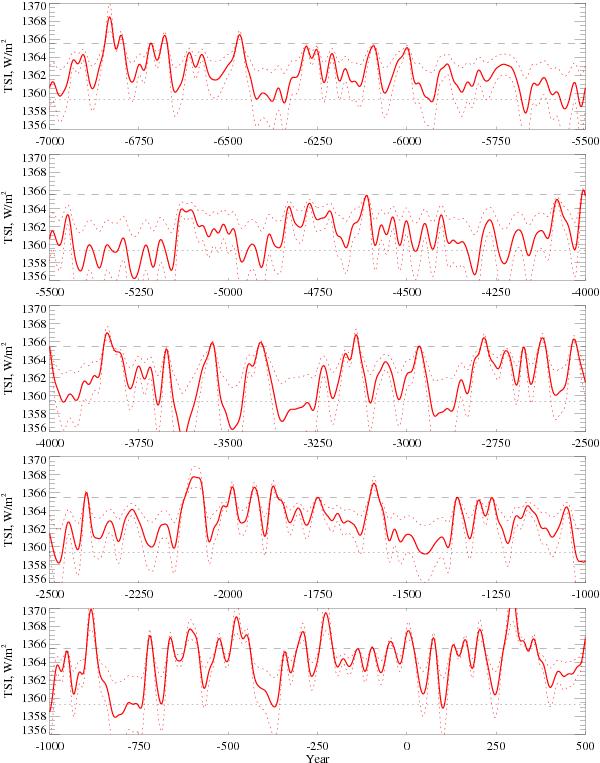
TSI reconstruction from 7000 BC to 500 AD. The reconstruction is based on the modulation potential derived from the 10Be records from the Greenland Ice core Project.Red dotted lines indicate the estimated error bars of the reconstruction. Black dashed and dotted lines indicate the TSI for the 1996 solar minimum and the lowest TSI during the Maunder minimum, respectively.
Current usage metrics show cumulative count of Article Views (full-text article views including HTML views, PDF and ePub downloads, according to the available data) and Abstracts Views on Vision4Press platform.
Data correspond to usage on the plateform after 2015. The current usage metrics is available 48-96 hours after online publication and is updated daily on week days.
Initial download of the metrics may take a while.