Fig. 1
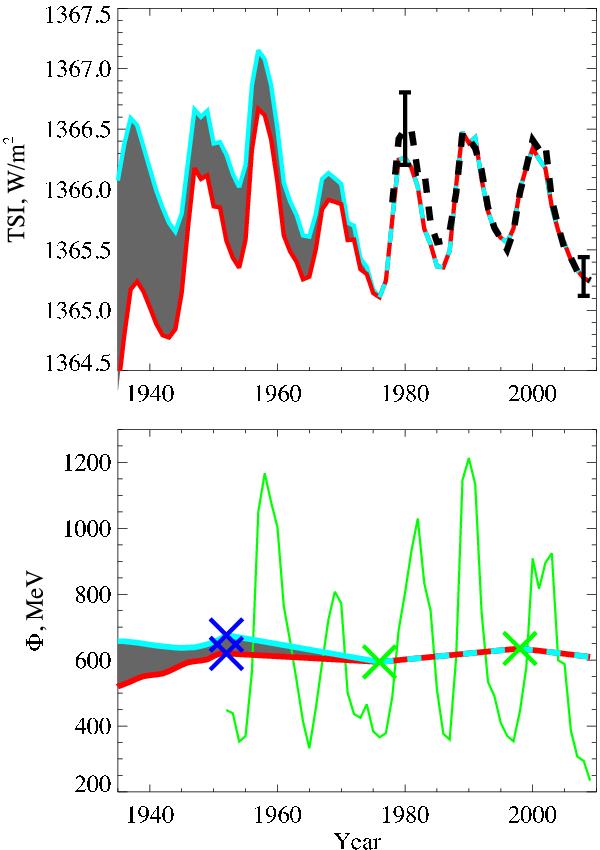
Modulation potential and TSI reconstruction for the last 70 years. Lower panel: yearly averaged neutron monitor data (green) and two modulation potential composites (red and cyan curves, see the discussion in the text). Upper panel: TSI reconstructions based on the two modulation potential composites (red and cyan curves). The black dashed line is the observed TSI from the PMOD composite. The error bar for 1980 corresponds to 1/4 the difference between two published TSI composites, and the error for 2008 is taken from Fröhlich (2009). The reconstructed TSI curves are normalized to the 1996 minimum and the gray-shaded region indicates the intrinsic uncertainty caused by differences in the modulation potential data.
Current usage metrics show cumulative count of Article Views (full-text article views including HTML views, PDF and ePub downloads, according to the available data) and Abstracts Views on Vision4Press platform.
Data correspond to usage on the plateform after 2015. The current usage metrics is available 48-96 hours after online publication and is updated daily on week days.
Initial download of the metrics may take a while.