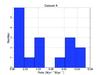
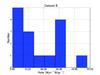
Fig. 1

Histogram of the fit results across the different rate functions and luminosity functions (as listed in Table D.1). The left plot shows the result for dataset “A” (reliable redshift values), while the right plot shows the results for dataset “B” (reliable and probable redshift values). The individual rates are always above zero with a minimum rate of 0.25 Myr-1 Mpc-3 for dataset “A” and 0.066 Myr-1 Mpc-3 for dataset “B”.
Current usage metrics show cumulative count of Article Views (full-text article views including HTML views, PDF and ePub downloads, according to the available data) and Abstracts Views on Vision4Press platform.
Data correspond to usage on the plateform after 2015. The current usage metrics is available 48-96 hours after online publication and is updated daily on week days.
Initial download of the metrics may take a while.