Fig. 9
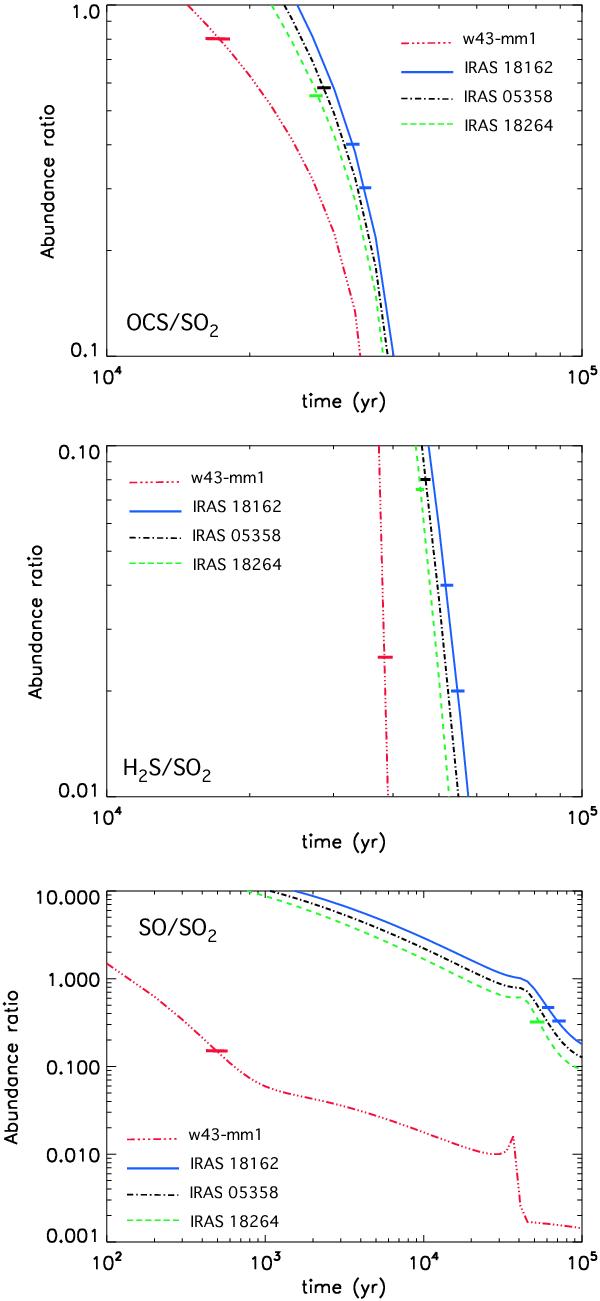
OCS/SO2 (upper panel), H2S/SO2 (middle panel) and SO/SO2 (lower panel) abundance ratios as a function of time at radius where the temperature is 100 K in the four studied sources. Initial composition of Model 2 is used. For each source, the observed abundance ratio is reported on the curves as horizontal thick line. Two values are drawn for IRAS 18162 as two SO2 abundances have been determined using two different lines (see Herpin et al. 2009). No observed value SO/SO2 is reported for IRAS 05358.
Current usage metrics show cumulative count of Article Views (full-text article views including HTML views, PDF and ePub downloads, according to the available data) and Abstracts Views on Vision4Press platform.
Data correspond to usage on the plateform after 2015. The current usage metrics is available 48-96 hours after online publication and is updated daily on week days.
Initial download of the metrics may take a while.