Free Access
Fig. 7
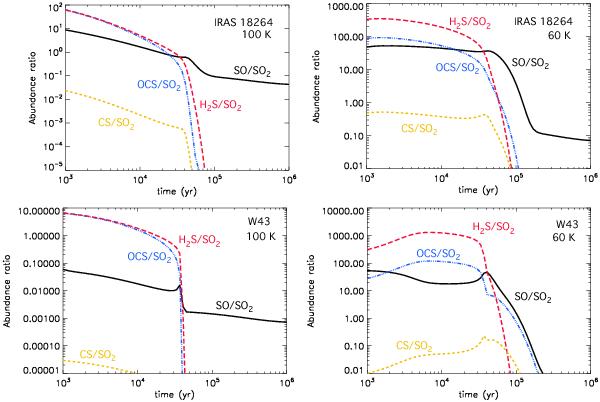
SO/SO2, OCS/SO2, H2S/SO2 and CS/SO2 abundance ratios as a function of time at radius where the temperatures are 60 K (right panels) and 100 K (left panels) in IRAS 18264 and W43-MM1. Initial composition of Model 2 is used.
Current usage metrics show cumulative count of Article Views (full-text article views including HTML views, PDF and ePub downloads, according to the available data) and Abstracts Views on Vision4Press platform.
Data correspond to usage on the plateform after 2015. The current usage metrics is available 48-96 hours after online publication and is updated daily on week days.
Initial download of the metrics may take a while.