Fig. 6
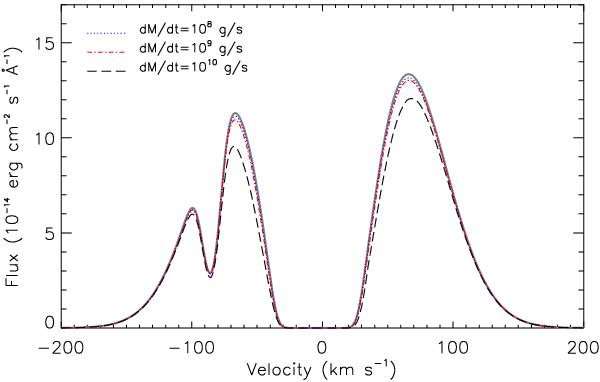
The GJ 436 Lyα spectrum during the transit of GJ 436b. The star spectrum before or after the transit is shown by a thick grey line. The spectrum resulting from the absorption by the planetary exophere during the transit is shown for various escape rates. The blue dotted, the red dot-dashed, and black long-dashed lines show the resulting spectrum when the escape rate is 108, 109, and 1010 g s-1, respectively. With this last escape rate, the blue side of the line is absorbed by about 17%, resulting in a decrease of about 11% in the total Lyman-α flux.
Current usage metrics show cumulative count of Article Views (full-text article views including HTML views, PDF and ePub downloads, according to the available data) and Abstracts Views on Vision4Press platform.
Data correspond to usage on the plateform after 2015. The current usage metrics is available 48-96 hours after online publication and is updated daily on week days.
Initial download of the metrics may take a while.