Fig. 4
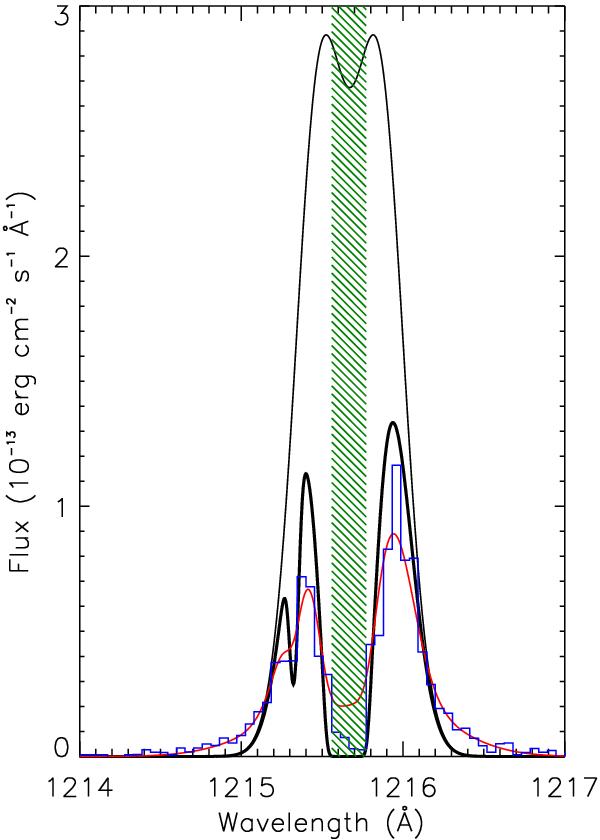
Plot of the theoretical profile of GJ 436’s Lyα line. The black thin line shows the intrinsic stellar emission line as seen by hydrogen atoms escaping the planetary atmosphere. The black thick line shows the resulting profile after absorption by the ISM hydrogen and deuterium. The line profile convolved with the HST G140M instrumental line spread function (red line) is compared to the observations (blue histogram), yielding a good fit with a χ2 of 34.5 for 39 degrees of freedom. The location of the (subtracted) air glow is indicated by green hatches.
Current usage metrics show cumulative count of Article Views (full-text article views including HTML views, PDF and ePub downloads, according to the available data) and Abstracts Views on Vision4Press platform.
Data correspond to usage on the plateform after 2015. The current usage metrics is available 48-96 hours after online publication and is updated daily on week days.
Initial download of the metrics may take a while.