Fig. 3
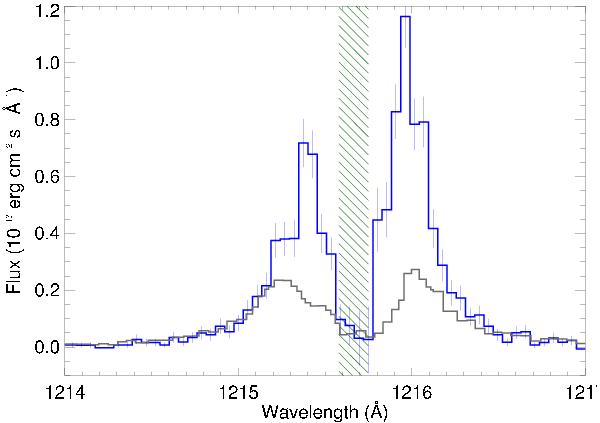
Zoom on the Lyα line of GJ 436 measured with STIS/G140M with error bars from the STIS pipeline (blue curve). The STIS spectrum of HD 209458 obtained by Vidal-Madjar et al. (2003) is shown for comparison (grey curve). As seen from Earth, the nearby M dwarf clearly shows a more intense stellar emission and a narrower ISM absorption. The location of the air glow (subtracted here) is indicated by green hatches.
Current usage metrics show cumulative count of Article Views (full-text article views including HTML views, PDF and ePub downloads, according to the available data) and Abstracts Views on Vision4Press platform.
Data correspond to usage on the plateform after 2015. The current usage metrics is available 48-96 hours after online publication and is updated daily on week days.
Initial download of the metrics may take a while.