Fig. 7
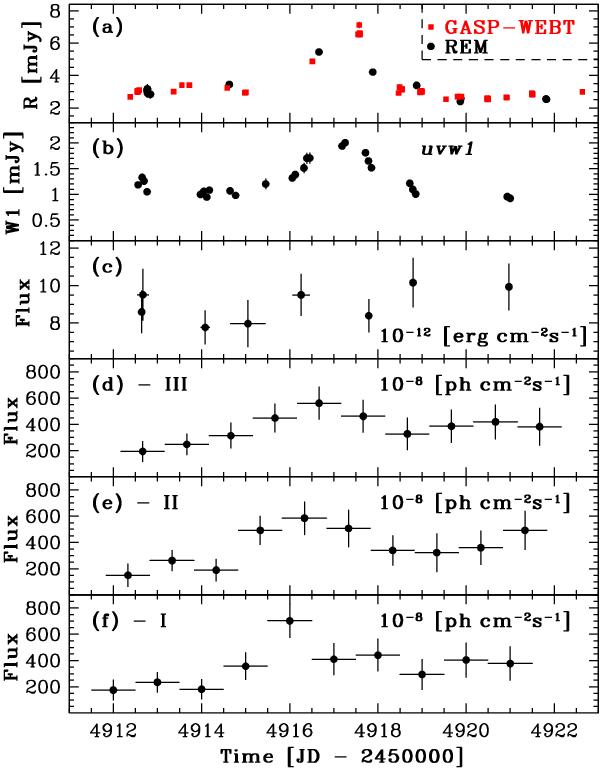
Comparison of the R-band light curve of PKS 1510−089 (panel a); GASP-WEBT: red squares, REM: black dots) with the uvw1 band data by Swift/UVOT (panel b)), the X-ray data by Swift/XRT (panel c)), and the AGILE γ-ray light curves in the three different configurations (panel d)–f), see Sect. 8.2 for details) during 21–31 March 2009 (JD 2 454 913.5–2 454 922.0).
Current usage metrics show cumulative count of Article Views (full-text article views including HTML views, PDF and ePub downloads, according to the available data) and Abstracts Views on Vision4Press platform.
Data correspond to usage on the plateform after 2015. The current usage metrics is available 48-96 hours after online publication and is updated daily on week days.
Initial download of the metrics may take a while.