Fig. 6
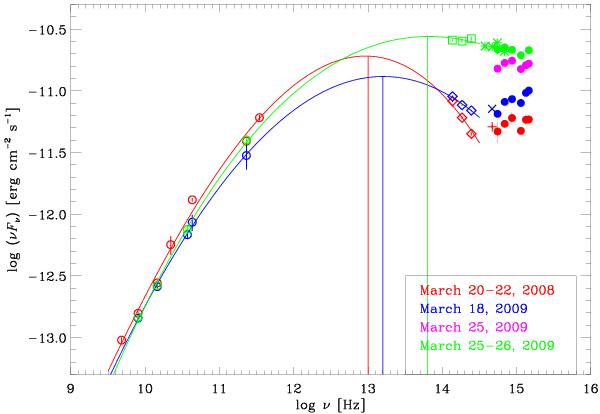
SEDs of the low-energy part of the spectrum constructed with data collected by GASP-WEBT (empty circle), KVA (plus sign), Abastumani (cross), St. Petersburg (asteriks), Campo Imperatore (diamonds), REM (squares), and Swift/UVOT (filled circles) during March 2008 and March 2009. A cubic polynomial fit was applied to the SEDs for locating the position of the synchrotron peak.
Current usage metrics show cumulative count of Article Views (full-text article views including HTML views, PDF and ePub downloads, according to the available data) and Abstracts Views on Vision4Press platform.
Data correspond to usage on the plateform after 2015. The current usage metrics is available 48-96 hours after online publication and is updated daily on week days.
Initial download of the metrics may take a while.