Free Access
Fig. 4
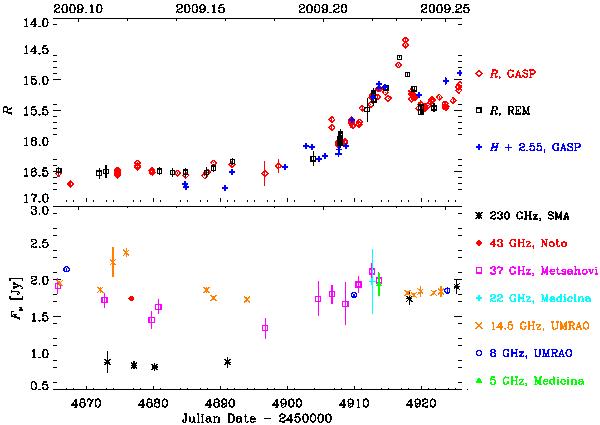
R-band light curve of PKS 1510−089 obtained by GASP and REM during February–March 2009, together with the H band data by GASP (top panel), compared with the radio flux densities at different frequencies (bottom panel).
Current usage metrics show cumulative count of Article Views (full-text article views including HTML views, PDF and ePub downloads, according to the available data) and Abstracts Views on Vision4Press platform.
Data correspond to usage on the plateform after 2015. The current usage metrics is available 48-96 hours after online publication and is updated daily on week days.
Initial download of the metrics may take a while.