Fig. 3
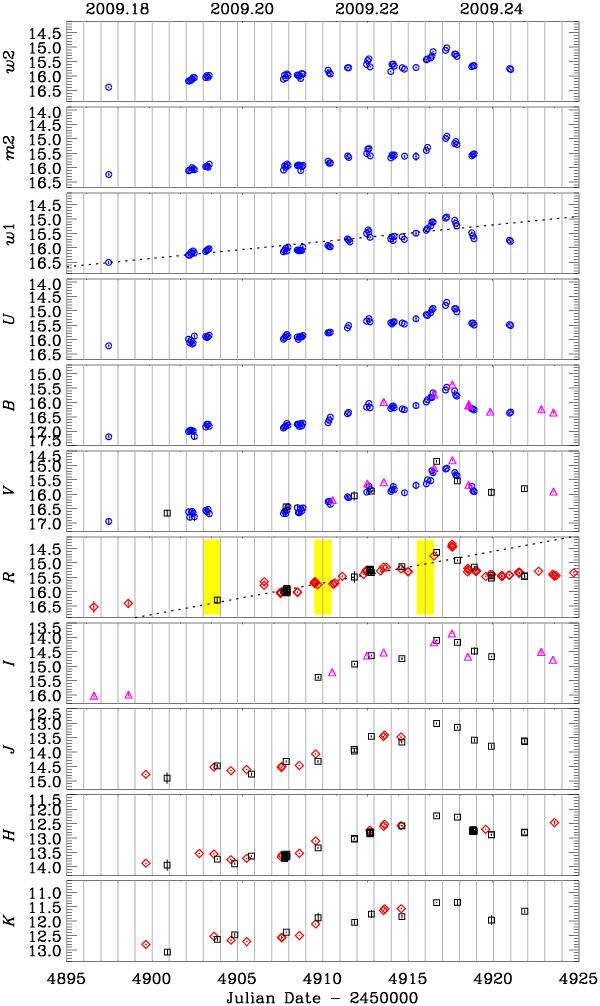
Light curves collected in near-IR, optical and UV bands, between 5 March and 2 April 2009 (JD 2454895.5–2454924.5). Blue circles represent the UVOT data in v, b, u, uvw1, uvm2, uvw2 filters. Red diamonds represent GASP data in R, J, H, and K bands. Magenta triangles represent WEBT data in I, V, and B bands. REM data in V, R, I, J, H, and K bands are represented with black squares. Yellow regions in R-band light curve indicate the peaks of γ-ray activity observed by AGILE.
Current usage metrics show cumulative count of Article Views (full-text article views including HTML views, PDF and ePub downloads, according to the available data) and Abstracts Views on Vision4Press platform.
Data correspond to usage on the plateform after 2015. The current usage metrics is available 48-96 hours after online publication and is updated daily on week days.
Initial download of the metrics may take a while.