| Issue |
A&A
Volume 529, May 2011
|
|
|---|---|---|
| Article Number | A151 | |
| Number of page(s) | 8 | |
| Section | Interstellar and circumstellar matter | |
| DOI | https://doi.org/10.1051/0004-6361/201016013 | |
| Published online | 22 April 2011 | |
Modelling of surface chemistry on an inhomogeneous interstellar grain
1
Leiden Observatory, Leiden University,
PO Box 9513,
2300 RA
Leiden,
The Netherlands
e-mail: cuppen@strw.leidenuniv.nl
2
Department of Astronomy, Cornell University,
Ithaca, NY
14853-6801,
USA
Received:
28
October
2010
Accepted:
30
March
2011
Context. Many interstellar molecules are formed through grain surface reactions. These reactions are usually modelled using rate equations, while considering a homogeneous grain with only one type of binding site for each species. However, amorphicity and the irregular character of interstellar dust grains make inhomogeneous grain surfaces much more likely.
Aims. The aim of this study is to investigate the effect of surface inhomogeneity on surface reaction rates. The formation of molecular hydrogen is here taken as an example.
Methods. The continuous-time random-walk Monte Carlo method is used to study the dependence of the H2 formation rate on surface size, fraction of strong binding sites and the distribution of these sites for different temperatures and bond strengths. Classical rate equations and modified rate equations are applied to try to reproduce these results.
Results. The H2 formation efficiency is strongly affected by the introduction of a second type of binding site. This effect depends on the strength of the binding energy and the fraction of strong binding sites. The way in which the sites are distributed can change the formation rate by as much as four orders of magnitude. Classical rate equations fail to reproduce the formation rate for all tested situations. Modified rate equations are able to obtain a reasonable agreement with the Monte Carlo results for inhomogeneous surfaces with randomly distributed sites consisting of less than 30% strong sites.
Conclusions. Since the different types of binding sites on interstellar grains are probably randomly distributed, we recommend the use of modified rate equations in gas grain models to include the effect of surface inhomogeneity. This method reproduces the most important features while being computationally inexpensive.
Key words: astrochemistry / methods: numerical / methods: analytical / ISM: atoms / ISM: molecules
© ESO, 2011
1. Introduction
Grain surface reactions are recognised to play a key role in interstellar chemistry. Many important molecules such as H2, CH3OH and H2O are believed to be formed predominantly on the surfaces of dust grains. For this reason there is a growing awareness that, in order to model the chemical evolution realistically, both gas and grain surface chemistry should be included. A range of different modelling methods has been applied as will be discussed below; all with different advantages and disadvantages. They have in common that they generally consider the grain surface to be homogeneous, i.e., one type of binding sites. In reality, interstellar grains are most likely far from homogeneous due to for instance surface roughness. This can have a strong effect on the reaction efficiency (Cuppen & Herbst 2005; Cuppen et al. 2006). In this paper the effect of the inhomogeneity of binding sites on surface reactions is studied. Two different kinds of binding site are introduced on the grain, in order to mimic some of the inhomogeneity of real interstellar grains. We will use the formation of molecular hydrogen on olivine as a test case, but the observed trends will most likely hold for different surface reactions on different surfaces as well.
The general consensus is that molecular hydrogen can be formed by a diffusive mechanism, called Langmuir-Hinshelwood, in the very cold regions below ~20 K (Hollenbach & Salpeter 1971). However, according to an analysis based on laboratory results on olivine (Katz et al. 1999), which was treated as possessing a smooth surface, the surface formation of H2 occurs efficiently over a very small temperature range (6−9 K). In three of our papers (Chang et al. 2005; Cuppen & Herbst 2005; Cuppen et al. 2006), we treat olivine as having a rough or amorphous surface, including sites with higher desorption energies than the standard value. In all cases, it was found that H2 could be formed efficiently over a wider range of temperatures and so explain the observed abundance of the molecule in diffuse clouds (R = 10-17 cm3 s-1 by Jura 1974). This was later experimentally confirmed by Perets et al. (2007).
The continuous-time, random-walk (CTRW) method is used, which follows the individual atoms and molecules on the grain surface, while a specific surface structure can be included. The method is however computationally too expensive to be applied for a large chemical network. The aim is therefore to compare the results of this method with the classical and modified-rate methods, which can be used to simulate large gas-grain networks. Wolff et al. (2010) also compared classical rate equations to Monte Carlo simulations with two types of sites. They found a good agreement between both methods in the regime where the efficiency for H2 formation is large (>~0.1). Here we are more interested in finding a robust modelling method that will describe surface reactions in general over a large regime of different conditions; including the regime where the reactions are rather inefficient (accretion limit).
Section 2 introduces the concept of inhomogeneity in binding energies and gives possible origins for this inhomogeneity. Section 3 discusses the three modelling methods used in the present paper. In Sect. 4 the results will be presented in terms of temperature and size dependence, dependence on the fraction, and the distribution of strong binding sites. We will discuss these results and make recommendations for the modelling of inhomogeneous grains in Sect. 5.
2. Inhomogeneity
Inhomogeneity in binding energies can have different origins: surface roughness, amorphicity, or a mixture of grain material. On a rough grain surface the binding to the protrusions is stronger than to the flat surface. These stronger binding sites can trap the species on the surface while the weaker binding sites allow the species to diffuse and find the trapped species. Also the amorphicity of the grain can introduce a whole range of different binding energies (Chang et al. 2005). Furthermore, the grains can be inhomogeneous in their chemical composition, with silicate and amorphous-carbon areas. On interstellar grains all three effects will probably lead to an inhomogeneity of binding sites, with the surface roughness as largest contributor. Flat and smooth surfaces are very hard to produce, even under well-controlled conditions. Since interstellar grains are produced in extreme conditions, they are most likely very rough and chemically inhomogeneous.
Hornekær et al. (2003, 2005) and Fillion et al. (2009) have experimentally shown that an increase in surface roughness and porosity of an amorphous solid water ice can indeed affect the binding of H2. More porosity or roughness leads to a wider distribution of binding energies with a higher mean value. The exact preparation of the water ice substrate is key to the amount of porosity. Perets et al. (2007) showed a similar effect occurs for silicates. Computer simulations of molecular hydrogen formation under interstellar conditions, i.e., using much lower fluxes than under laboratory fluxes, had already shown that an increase in surface roughness allowed H2 formation at higher temperatures (Chang et al. 2005; Cuppen et al. 2006; Cuppen & Herbst 2005).
Chemisorption wells are another example of stronger binding sites. H atoms are found to be able to chemisorb to olivine without hardly feeling a barrier, since the barrier for chemisorption is in the same order as the physisorption binding energy (Goumans et al. 2009). Chemisorption will not be explicitly introduced in our model, since it is very specific to the substrate and absorbant and our goal is to test a more generally applicable method. In the temperature regime we are interested in, H2 formation through chemisorption sites will probably only have a minor contribution, since it proceeds by a Eley-Rideal like mechanism. We expect Langmuir-Hinshelwood to be more important under these conditions, since the surface abundance is low.
Since our goal is to develop a method that can simulate grain surface chemistry for a large chemical network and over large timescales, we only add one extra type of binding site to keep the concept computationally cheap and simple. As we will show in this paper, adding only one extra binding site already reproduces most of the effects that are found for inhomogeneous grains (Chang et al. 2005; Cuppen & Herbst 2005). In this paper the extra binding sites are implemented in a similar way to Cuppen et al. (2006) for Surface II. We also refer to this paper for an additional discussion on surface inhomogeneity and the implementation of this into Monte Carlo models.
3. Modelling methods
The first gas-grain codes that combined gas and grain surface chemistry treated the grain surface reactions in a similar way to the gas phase reactions, using rate equations for both (Tielens & Hagen 1982; Hasegawa et al. 1992). Rate equations have their limitations in the fact that they ignore the discrete nature of the atoms and molecules involved in the surface reactions. For large surface abundances, this is not a problem. However, if grains are on average populated by less than one particle, this can become a problem, since clearly at least two reacting species should be present to allow for reaction. As a result, rate equations can overestimate the production rates by several orders of magnitude in the so-called accretion limit (see Charnley et al. 1997).
Different stochastic methods have been considered to overcome this problem. The main focus has been around the master equation method (Biham et al. 2001; Green et al. 2001; Stantcheva et al. 2002) and macroscopic Monte Carlo simulations (Charnley 1998, 2001; Stantcheva et al. 2002). Of the two, the master equation method can be most easily coupled to rate equations that handle the gas phase chemistry in the most straightforward way, since it treats the gas and surface kinetics with equations of similar form.
Because Monte Carlo methods use random numbers and probabilities instead of analytical expressions, coupling between the two methods (rate equations for the gas and Monte Carlo for the grain) is harder to achieve. An attempt has been made with the continuous-time, random-walk Monte Carlo method for a limited surface network by assuming that the surface chemistry only has a marginal effect on the gas phase chemistry in quiescent dense clouds (Chang et al. 2007). Recently, macroscopic Monte Carlo simulations of both the gas phase and grain surface chemistry have been carried out for a proto-planetary disk (Vasyunin et al. 2009), where the gas and grain chemistry interact more.
The master equation method specifically considers each possible configuration of species. For a system where only H and H2 are considered on the grain, possible configurations would be (1, 0) with one H atom and no H2 molecules on the grain, (0, 0), (0, 1), (1, 1), (2, 0), etc.. The number of possibilities is clearly infinite, but selective cut-offs can be used to exclude the higher order terms if their probability of occurrence becomes very small. However, if the number of species expands, either by a change in physical conditions or by increasing the number of considered species in the model, the equations blow up rapidly. Algorithms have been suggested to make the effect less dramatic and to extend the range in which the rate equation method is applicable (Lipshtat & Biham 2004; Barzel & Biham 2007).
Apart from the stochastic methods, some modifications to the rate equations have been put forward to mimic the stochastic behaviour of the surface chemistry. Caselli et al. (1998) made semi-empirical adjustments to the rates of a selection of reactions, for the case where the surface migration of atomic hydrogen is significantly faster than its accretion rate onto grains. While this method showed only limited success, the more recent modified-rate approach suggested by Garrod (2008) has been much more successful. Garrod et al. (2009) have also shown that the new method produces an excellent match to master-equation solutions to full gas-grain chemical systems for a range of physical conditions, albeit for systems that employ only a single type of grain-surface binding site (see below). The rate expressions of Garrod (2008) are here referred to as the modified rate equations, and an example will be given in Sect. 3.3. Their main advantages are that they are computationally inexpensive as compared to the stochastic methods and that they automatically switch to the normal rate equation in the regime where those are still valid.
All of the methods mentioned above suffer from the same deficiency, namely that they overlook the microscopic surface characteristics of the grain. Such methods necessarily deal with the behaviour of generic “abundances” and cannot trace the individual motions of particles on the grain surfaces. Layering and topology effects are also frequently ignored. As mentioned above, surface roughness or other types of surface irregularities can have a strong effect on the reaction efficiency (Cuppen & Herbst 2005; Cuppen et al. 2006).
3.1. The CTRW-Monte Carlo method
A continuous-time, random-walk algorithm similar to Cuppen & Herbst (2005) is used. For a detailed description of the method we refer to Chang et al. (2005). The Monte Carlo algorithm consists of a sequence of events, deposition, desorption and hopping. At the start of each cycle all possible events are listed and, if necessary, assigned a time at which this event will occur. This list is ordered by event time and the first event on the list is executed. The event list is then updated again to start the next cycle. Deposition times of H atoms from the gas phase are determined according to  (1)with ρ the density of surface sites, F the flux of hydrogen atoms per area, X a random number between 0 and 1, and tcurrent the current time in the simulation. We use a surface density of 1015 sites cm-2 and a flux of 3.6 × 10⁶ atoms cm-2s-1, which corresponds to an atomic hydrogen density of 100 cm-3 at a gas temperature of 100 K. Desorption and hopping times of the individual H atoms on the surface are determined via
 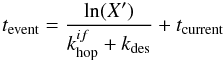 (2)where X′ is again a random number, and
  and kdes are respectively the hopping and desorption rate. These rates are calculated using their respective activation energies via a simple Arrhenius correlation
 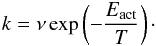 (3)The pre-exponential factor ν is chosen to be 1012 s-1 (Biham et al. 2001) and the activation energies are calculated from the site energies, Ej. The desorption is completely governed by the binding energy in this model. We assume that all processes are thermally activated and do not proceed through tunneling. As mentioned in the introduction, surfaces with two types of sites are used: with binding energy E0 = 373 K and E1 = 373(1 + α) K. The energy of 373 K is found as the desorption energy of H from a polycrystalline olivine surface (Katz et al. 1999) and the parameter α is used as a variable input parameter to change E1. We choose α = 0.4 and 1.0 and a variety of different grain sizes and site distributions.
The hopping barriers are determined through another parameter Ehop = 287 K, again taken from Katz et al. (1999). The barrier for hopping from initial site i with energy Ei to site f with Ef is 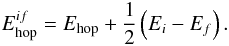 (4)This expression ensures microscopic reversibility. In the present paper only deposition of H atoms is considered. If an atom lands on a site that is already occupied by another H atom, it will react to form H2 and the newly formed molecule will desorb. In a similar way, reactions will occur if two hydrogen atoms reach each other through hopping across the surface.
3.2. Classical rate equations
The Monte Carlo results are compared to two types of rate equations. The classical rate equations that do not account for the accretion limit and the modified rate equation which mimics the stochastic behaviour of the Monte Carlo simulations by adjusting the expressions for reaction.
In both cases the grain consists of s sites of which s1 are of type 1. The change in N0, the number of H atoms on type 0 sites, can be described as 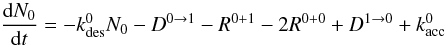 (5)with Da → b the diffusion rate of atoms on sites a to empty sites b, Ra + b the formation rate of H2 molecules by diffusion of an H atom from a site of type a to an occupied type b site, and
  the change in H atom abundance of type a due to accretion, which also includes an Eley-Rideal term:
 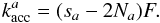 (6)For Eq. (5) we assume that the number of molecules that is formed by atoms diffusing from a type 1 site to an occupied type 0 site is negligible
  (7)In case of the classical rate equations both the reaction and diffusion terms are determined by the hopping rates:
 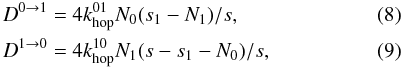 and
and 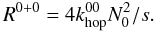 (10)Here we assume isolated type 1 sites which leads to the factors of 4, through assumed square lattice arrangement of surface sites. For D1 → 0, each isolated type 1 site can reach 4 neighbouring type 0 sites. For D0 → 1, each type 0 site has a probability of 4N1/s that at least one of its four neighbouring sites is an isolated type 1 site, since there are 4N1 type 0 sites that are adjacent to a type 1 site. In a similar fashion the change in N1 can be described
  (11)with
 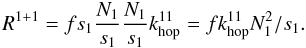 (12)and
 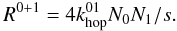 (13)The factor f in Eq. (12) represents the fraction of type 1 sites that have a neighbouring site of type 1. Only these sites can contribute to reactions between two atoms on type 1 sites. For surfaces with randomly distributed type 1 sites, the type 1 islands consist mostly of one or two sites. The reaction rate of H2 on the islands consisting of two or more adjacent sites is given by the number of type 1 sites that have such an adjacent site (fs1) multiplied by the probability that such a site is occupied (N1/s1) multiplied by the probability that the adjacent site is occupied (N1/s1) times the hopping rate between those sites (
 ). Since most of the type 1 islands will be fully embedded in type 0 sites, Eq. (13) is determined by the number of atoms on type 0 sites multiplied by the probability that an adjacent site is an occupied type 1 site (N1/s) times
  since each site has four neighbouring sites it can hop to.
The rate of H2 formation is then determined by  (14)which can be used to determine the formation efficiency as described in Sect. 4.
The H2 formation rate and the surface abundances N0 and N1 in this approach scale linearly with the size of the grain, s, and do not take into account any size effect. For small grains the approximation  (15)which is used to determine the reaction rates in Eqs. (10), (12) and (13), may break down and the rate equations overestimate the production rate. Modified rate equations artificially account for this and they will be discussed in the next section.
3.3. Modified rate equations
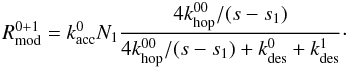
For the construction of the modified rate equations we follow Garrod (2008). In this approach, the expressions for the reactions are adjusted if the modified reaction rate is smaller than the classical rate. The modified reaction rate is determined by the accretion rate of one of the reactants times the surface abundance of the other reactant times an efficiency term that takes into account the competition between diffusion across the surface for the reactants and the desorption of the reactants. For R0 + 0 this becomes 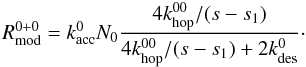 (16)and similarly
 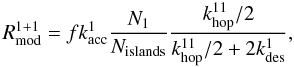 (17)with Nislands the number of type 1 islands which can be approximated by Nislands = (1 − f/2)s1 when these islands are predominantly of size 1 or 2, which holds for f < 0.1. The terms s − s1 and s1 account for the diffusion of the atoms across the type 0 and type 1 sites, respectively, before meeting a second atom and reacting. The type 0 sites are mostly arranged in one large continuous area and each type 0 atom can reach all other type 0 atoms. We therefore simply use the term N0. Type 1 atoms, on the other hand, can only reach the atoms within their small islands and the term N1/Nislands accounts for this.
In the case of atoms of type 0 reacting with type 1, we assume that the atoms first scan the type 0 part of the surface before reaching a type 1 site. The diffusion is therefore limited by  instead of
  :
:  (18)These modified reaction rates do not scale linearly with grain size and as a result the modified rate equations show size dependence.
4. Results
The formation of H2 is quantified in all modelling methods in terms of the efficiency of molecular hydrogen formation. This is defined as the ratio between the flux of incoming hydrogen atoms and twice the rate at which molecular hydrogen is formed  (19)Since the Monte Carlo technique uses discrete numbers instead of rates, the formation rate cannot be determined directly. For this reason, we approximate the efficiency by
  (20)where NH is the number of hydrogen atoms that approach the surface in a given time interval and NH2 the number of molecules formed in that interval. We monitor the number of hydrogen atoms on the surface until a steady state is reached. Under steady-state conditions the H atom population simply fluctuates around an average value and we sample until the cumulative average after steady state reaches a constant level. The time to reach steady state and the average value depends on the choice of the parameter α, temperature, surface size and site distribution. The fluctuations are generally within the size of the symbols, except for the bottom panels of Figs. 2 and 4, where the fluctuations span roughly twice the symbol size because of the difference in dynamic range of the y-axis. The accuracy of the sampling depends on the number of formed H2 molecules. Since the percentage of Monte Carlo events leading to H2 (as compared to diffusion or desorption) decreases with temperature, longer simulation times are needed to obtain the same sampling accuracy with temperature. Simulations at T = 16 K have not reached the same sampling accuracy as for the other temperatures, but the error in the sampling always remains within the fluctuation range.
All efficiencies determined by the Monte Carlo program are compared to efficiencies obtained by “classical” rate equations and the modified rate method.
4.1. Temperature dependence
To illustrate the effect of the introduction of stronger binding sites, Monte Carlo simulates have been performed for different temperatures for a surface with only type 0 sites and for surfaces consisting of 1% of type 1 sites randomly distributed across the grain. Our standard lateral interactions of α = 0.4 and 1.0 are used and the surfaces have 300 × 300 sites. Figure 1 plots the resulting H2 formation efficiency as a function of temperature. The graph clearly shows that the introduction of stronger binding sites expands the temperature regime in which H2 can be efficiently formed to higher temperatures. These sites act as traps where the H atoms will stay at elevated temperatures. Atoms landing on type 0 sites scan the surface and find these trapped atoms to react with. The presence of just a few type 1 sites already leads to an increase of the temperature regime. The strength of the type 1 sites, i.e., the α-value, will determine the final temperature regime. For the α-values chosen in this paper, the formation rate approaches zero above 20 K. Higher α-values or more types of strong binding sites can extend this regime to higher temperatures. At high temperatures T > 100 K chemisorption sites are expected to become important in the formation process.
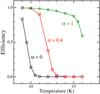 |
Fig. 1 Molecular hydrogen formation efficiency as a function of temperature for only type 0 sites (circles), α = 0.4 (squares) and α = 1.0 (diamonds). |
In the remainder of the paper, the influence of grain size, number of strong sites and the distribution of these sites on the H2 formation efficiency will be studied for four different temperatures: 10, 12, 14, and 16 K. The results will be compared to other modelling methods with the aim to reproduce the Monte Carlo simulations.
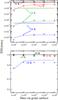 |
Fig. 2 Molecular hydrogen formation efficiency as a function of grain size for (top) α = 0.4 and (bottom) α = 1.0. Monte Carlo results are indicated with circles (10 K), squares (12 K), diamonds (14 K) and crosses (15 K), solid and dashed lines represent the classical and modified rate equation results, respectively. In the bottom panel, the 10, 12, and 14 K (modified) rate equations results overlap. |
4.2. Size dependence
Monte Carlo simulations with a similar distribution of sites are performed for four different temperatures, 10, 12, 14, and 16 K, and two different α values. Surfaces of different sizes are generated for this purpose; all consisting of 1% of type 1 sites randomly distributed across the grain. Figure 2 shows the resulting efficiencies. The symbols indicate the Monte Carlo simulations and the solid and dashed lines represent the classical and modified rate equation results, respectively. The rate equation method does not take into account any size dependence, resulting in the horizontal lines.
The Monte Carlo simulations show a size dependence up to an array size of 104 sites for physical conditions that result in very low efficiencies: low α-value or high temperature. For other conditions, size effects occur at even smaller grain sizes. Figure 3 shows the average number of hydrogen atoms on the surface during steady state. There appears to be a power-law dependence of the number of atoms on the grain size. This power law even holds for the conditions where the efficiency deviates from the large grain limit.
The rate equations strongly overestimate the Monte Carlo results (Fig. 2). The modified rate equations follow the efficiency values of the Monte Carlo simulations much more closely. The number of H atoms on the grain (Fig. 3) are also relatively well reproduced for the conditions where the efficiency is ≪ 1. The Monte Carlo results indicate that above an array size of 104 site there appears to be no size effect. One would expect the system to be in the deterministic regime for these circumstances and the classical and modified rate approach to coincide. Figure 3 further supports this thought since for α = 0.4 at 12 K, the number of H atoms on a large grain is much larger than 1. However, the classical and modified rate equations results do not coincide as they would under a deterministic regime. The reason is that the number of H atoms on type 0 sites and number of H atoms per type 1 island are both much smaller than one. The efficiency increases further according to the modified rate equations when the array size is 2 × 10⁸ or larger (not shown in figure) and when also the number of type 0 H atoms becomes larger than 1. The classical rate equation efficiency is never reached since R0 + 1 is always larger than  since R0 + 1 is determined by
  whereas the modified reaction rate uses the much smaller
  after the realisation that the diffusion is limited by the type 0 atoms reaching the type 1 sites.
4.3. Site dependence
In this section the dependence of the formation efficiency on the fraction of sites of type 1 is studied. Monte Carlo simulations with a different percentage of type 1 sites are performed for four different temperatures, 10, 12, 14, and 16 K, and two different α values. The type 1 sites are randomly distributed across the grain surface which consists of 300 × 300 sites in total. Figure 4 gives the resulting efficiencies. The figure shows a strong dependence of the efficiency on the fraction of sites of type 1 and temperature for a small energy difference between the two sites (top panel). The efficiency clearly decreases with temperature and increases with fraction of type 1 sites. This is in agreement with the expected trend. A higher temperature results in a shorter residence time for the H atoms on the surface, and hence a lower probability to find a second atom to react with. If the residence time becomes too short with respect to the hydrogen flux, the chance of finding two hydrogen atoms on the surface drops rapidly and as a consequence the efficiency drops as well. If the sites of type 1 have twice the binding energy of site 0 (bottom panel), the dependence is less strong in this temperature regime. The efficiency approaches one when the fraction of type 1 sites increases to a fully covered grain surface for all investigated temperatures.
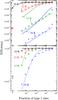 |
Fig. 4 Molecular hydrogen formation efficiency as a function of the fraction of type 1 sites for 10, 12, 14, and 16 K and (top) α = 0.4 and (bottom) α = 1.0. Symbols similar to Fig. 2. |
The solid and dashed lines in Fig. 4 represent the classical and modified rate equation results, respectively. For the grains with a small fraction of type 1 sites, most of these sites are isolated and the contribution of R1 + 1 becomes negligible. This term becomes more important with increasing fraction. This change in relevance of R1 + 1 is regulated by the parameter f in Eqs. (12) and (17). For the randomly distributed type 1 sites that are discussed here, this parameter can be estimated by 1 − (1 − s1/s)4. The surfaces used in the Monte Carlo simulations indeed follow this relation.
The classical rate method overestimates the Monte Carlo results up to a few orders of magnitude in the regime where the efficiency is much less than one. For the surfaces that consists of only type 0 sites, the discrepancy is less severe (compare plus signs and the Monte Carlo symbols). For homogeneous grains, the discrepancy is mainly due to the missing backdiffusion term in the rate equation model. When an atoms scans the grain surface, it can visit a site more than once, which is called backdiffusion. This effect can cause the rate equations to overestimate the molecular hydrogen formation rate up to a factor of 3 depending on the physical conditions (Lohmar & Krug 2006).
Further deficiencies of the rate equation method are found when a second type of site is added to the surface, resulting in larger discrepancies with Monte Carlo results. A large contribution to the efficiency derives from reactions where atoms diffuse from type 0 sites into occupied type 1 sites. Since this reaction is badly described in the classical method, the discrepancy with the Monte Carlo results becomes larger. Figure 4 shows indeed that agreement of the modified rate equation with the Monte Carlo results is much better since it uses a more accurate description of R0 + 1.
The modified rate equation approach has a very good agreement with the Monte Carlo results for efficiencies of η ≤ 0.3 and with less than 30% of type 1 sites. For surfaces with a larger fraction of type 1 sites, the contribution of R1 + 1 becomes stronger and the picture of H2 mainly forming through atoms landing on type 0 sites, hopping over the surface to find a stronger binding site, and then reacting with an atom that is residing there is no longer valid.
4.4. Surface dependence
The previous Monte Carlo simulation runs are all performed on surfaces that have a random distribution of the strong binding sites. However, depending on the origin of the inhomogeneity of binding energies, the sites can have different distributions. If the amorphicity of the grain material is causing this inhomogeneity, the stronger binding sites are probably indeed randomly distributed. If surfaces roughness is the origin, these sites are located at surface steps which are dispersed in lines on the surfaces on a relatively smooth surface. On a very rough surface, the strong binding sites will again probably be randomly distributed. Finally, the grains can be inhomogeneous in their chemical composition, with silicate and amorphous-carbon areas. In this case the different binding sites are probably well separated in large patches. In reality, all three scenarios may play a role. This section discusses how the distribution of sites influences the efficiency of H2 formation. For this purpose, nine different surfaces are created, each of the same size (300 × 300) and number of strong binding sites (900), but with a different distribution of these sites. Apart from the random distributions, there are five surfaces that have all their sites in one rectangular patch of a specified aspect ratio (300 × 3, 180 × 5, 90 × 10, 60 × 15, and 30 × 30); two surfaces with equally-spaced small islands (900 (1 × 1) and 225 (2 × 2)) of strong binding sites; and finally, one surface with two vertical and one horizontal ridge of 300 × 1 binding sites each. Note that the 300 × 3 and 3 × 300 × 1 surfaces have a continuous island of type 1 sites, due to periodic boundary conditions.
Figure 5 plots the H2 formation efficiency on these nine surfaces for different temperatures and α values. In these graphs the surfaces are ordered by interface length between strong and weak binding sites. The 900 1 × 1 islands clearly have the maximum interface length whereas the 30 × 30 island has the minimum. One would expect that the longer this interface the higher the probability for atoms to get trapped on strong binding sites, resulting in a higher H2 formation efficiency. Figure 5 shows that this is not the case, however. The interface length of the three ridges and 225 small islands is the same, but the efficiency is clearly different. One reason for this behaviour could be in the difference in distance between the type 1 islands. H2 formation roughly follows two steps; first, an atom lands on the type 0 sites and it starts scanning the surface for type 1 islands. Once it finds such an island, H2 formation will be almost instantaneous if this island contains another hydrogen atom. The rate-limiting step will be for the hydrogen atom to reach such an island. The longer this takes, the more likely that the atom will desorb. Isotropic isolated islands are much harder to reach than long ridges on the surface. Many small islands require less hopping events than larger islands with the same total surface areas, since the travelled distance scales with N2, where N is the number of hopping events. Another origin for this difference could be a size effect. The small islands could be considered as small individual grains with their own accretion limit.
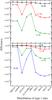 |
Fig. 5 Molecular hydrogen formation efficiency for different distribution of sites for (top) α = 0.4 and (bottom) α = 1.0. A fraction of 1% consists of strong binding sites. Symbols similar to Fig. 4. Errors are again within the symbol size and the lines are to guide the eye. |
The surfaces that contain only one single patch of strong binding sites do not show a clear trend either. It is surprising that for α = 1.0 the 30 × 30 has a higher efficiency than the 60 × 15 surface.
The modified rate equation expressions reproduce the randomly distributed results and the 900 × 1 × 1 results. The construction of (modified) rate equations that account for the distribution specifically are beyond the scope of this paper. For a discussion of the diffusion on a surface with a single square island of strong sites we refer the reader to Evans & Nord (1985).
5. Discussion and conclusions
We have shown that the introduction of a second type of binding site can have a strong influence on the formation rate of molecules through surface reactions. Not only does the strength of the binding energy of these sites and the fraction of the grain they make up influence the reaction rate, even the way in which they are distributed on the surface can change the formation rate by as much as four orders of magnitude.
With the introduction of the second type of binding site we aim to include some of the inhomogeneity of interstellar grain surfaces. This inhomogeneity is most likely due to the amorphous character of the grain and the irregular surface topology of the grain. In both cases the strong binding sites will be randomly distributed across the grain.
The effect is studied using the CTRW Monte Carlo technique. This method includes the stochastic nature of the H2 formation system and it follows the position of the H atoms on the grains, taking into account the actual random walk of the individual atoms. This method also allows for a specific arrangement of the strong binding sites and for the study of the influence of this arrangement on the final results. As mentioned above, the distribution can change the formation rate by as much as four orders of magnitude. Distributions in which the strong binding sites are spread across the grain surface appear to result in a higher rate, since the chance of reaching these before desorption is higher.
The disadvantage of the Monte Carlo technique is that it is computationally demanding and a complex grain surface chemistry is therefore preferably modelled using some type of rate equation approach, as long as this gives a reasonable description of the system. We have therefore benchmarked the formation rate results of classical and modified rate equation methods against the CTRW Monte Carlo method.
Classical rate equations, which do not include either the random walk or the stochastic aspect overestimate the reaction rate of inhomogeneous surfaces for all conditions tested in the present paper. The discrepancy can be up to three orders of magnitude. The agreement for surfaces with only one type of binding site is much better (plus symbols in Fig. 4). However, since we expect the irregular surfaces of interstellar grains and their amorphicity to lead to inhomogeneities in the bond strength between sites, classical rate equations will not be a good choice to try to reproduce the rate of grain surface reactions for a realistic surface.
The expressions constructed following the modified rate equations approach are able to obtain a reasonable agreement with the Monte Carlo results for inhomogeneous surfaces with randomly distributed sites consisting of less than 30% strong sites. Deviations from the Monte Carlo results are largest when the fraction of strong binding sites becomes very large, when the efficiency is close to unity, or when a non-random distribution of sites is used.
As mentioned above, we expect a random distribution of binding sites to be most representative of an interstellar grain and the modified rate equations will reproduce these results. A second type of binding site can be implemented in a relatively straightforward way as explained in the Appendix.
References
- Barzel, B., & Biham, O. 2007, ApJ, 658, L37 [NASA ADS] [CrossRef] [Google Scholar]
- Biham, O., Furman, I., Pirronello, V., & Vidali, G. 2001, ApJ, 553, 595 [NASA ADS] [CrossRef] [Google Scholar]
- Caselli, P., Hasegawa, T. I., & Herbst, E. 1998, ApJ, 495, 309 [NASA ADS] [CrossRef] [Google Scholar]
- Chang, Q., Cuppen, H. M., & Herbst, E. 2005, A&A, 434, 599 [NASA ADS] [CrossRef] [EDP Sciences] [Google Scholar]
- Chang, Q., Cuppen, H. M., & Herbst, E. 2007, A&A, 469, 973 [NASA ADS] [CrossRef] [EDP Sciences] [Google Scholar]
- Charnley, S. B. 1998, ApJ, 509, L121 [NASA ADS] [CrossRef] [Google Scholar]
- Charnley, S. B. 2001, ApJ, 562, L99 [NASA ADS] [CrossRef] [Google Scholar]
- Charnley, S. B., Tielens, A. G. G. M., & Rodgers, S. D. 1997, ApJ, 482, L203 [NASA ADS] [CrossRef] [Google Scholar]
- Cuppen, H. M., & Herbst, E. 2005, MNRAS, 361, 565 [NASA ADS] [CrossRef] [Google Scholar]
- Cuppen, H. M., Morata, O., & Herbst, E. 2006, MNRAS, 367, 1757 [NASA ADS] [CrossRef] [Google Scholar]
- Evans, J. W., & Nord, R. S. 1985, Phys. Rev. A, 32, 2926 [NASA ADS] [CrossRef] [PubMed] [Google Scholar]
- Fillion, J., Amiaud, L., Congiu, E., et al. 2009, Phys. Chem. Chem. Phys., 11, 4396 [NASA ADS] [CrossRef] [Google Scholar]
- Garrod, R. T. 2008, A&A, 491, 239 [NASA ADS] [CrossRef] [EDP Sciences] [Google Scholar]
- Garrod, R. T., Vasyunin, A. I., Semenov, D. A., Wiebe, D. S., & Henning, T. 2009, ApJ, 700, L43 [Google Scholar]
- Goumans, T. P. M., Richard, C., Catlow, A., & Brown, W. A. 2009, MNRAS, 393, 1403 [NASA ADS] [CrossRef] [Google Scholar]
- Green, N. J. B., Toniazzo, T., Pilling, M. J., et al. 2001, A&A, 375, 1111 [NASA ADS] [CrossRef] [EDP Sciences] [Google Scholar]
- Hasegawa, T. I., Herbst, E., & Leung, C. M. 1992, ApJS, 82, 167 [NASA ADS] [CrossRef] [Google Scholar]
- Hollenbach, D., & Salpeter, E. E. 1971, ApJ, 163, 155 [NASA ADS] [CrossRef] [Google Scholar]
- Hornekær, L., Baurichter, A., Petrunin, V. V., Field, D., & Luntz, A. C. 2003, Science, 302, 1943 [NASA ADS] [CrossRef] [PubMed] [Google Scholar]
- Hornekær, L., Baurichter, A., Petrunin, V. V., et al. 2005, J. Chem. Phys., 122, 124701 [NASA ADS] [CrossRef] [PubMed] [Google Scholar]
- Jura, M. 1974, ApJ, 191, 375 [NASA ADS] [CrossRef] [Google Scholar]
- Katz, N., Furman, I., Biham, O., Pirronello, V., & Vidali, G. 1999, ApJ, 522, 305 [NASA ADS] [CrossRef] [Google Scholar]
- Lipshtat, A., & Biham, O. 2004, Phys. Rev. Lett., 93, 170601 [Google Scholar]
- Lohmar, I., & Krug, J. 2006, MNRAS, 370, 1025 [NASA ADS] [CrossRef] [Google Scholar]
- Perets, H. B., Lederhendler, A., Biham, O., et al. 2007, ApJS, 661, L163 [NASA ADS] [CrossRef] [Google Scholar]
- Stantcheva, T., Shematovich, V. I., & Herbst, E. 2002, A&A, 391, 1069 [NASA ADS] [CrossRef] [EDP Sciences] [Google Scholar]
- Tielens, A. G. G. M., & Hagen, W. 1982, A&A, 114, 245 [NASA ADS] [Google Scholar]
- Vasyunin, A. I., Semenov, D. A., Wiebe, D. S., & Henning, T. 2009, ApJ, 691, 1459 [NASA ADS] [CrossRef] [Google Scholar]
- Wolff, A., Lohmar, I., Krug, J., Frank, Y., & Biham, O. 2010, Phys. Rev. E, 81, 061109 [NASA ADS] [CrossRef] [Google Scholar]
Appendix A: Implementation of a second binding site into gas-grain models
A second type of binding site can be implemented in a modified rate equation model by adding surface species to the model to represent species in stronger binding sites using the following steps
-
Select the species for which a second binding type is requiredand add these to the species list as separate species.
-
For each accretion term, account for the number of surface sites involved following Eq. (6).
-
Add diffusion terms between the two types of sites for the same species according to Eqs. (8), (9).
-
Add reaction terms between the two types of sites according to Eqs. (13) or (18) if
 .
. -
Modify the reaction terms for the normal sites according to Eqs. (10) or (16).
-
Modify the reaction terms for the strong sites according to Eqs. (12) or (17).
Since the exact nature of surface of interstellar grains is unknown, it is hard to give hard numbers for the number of strong sites and the α-value. From laboratory analogues, we extract that at least between 1 and 10% of the grain is populated by strong sites with an α-value between 0.4 and 1.0 (Perets et al. 2007).
The presence of strong binding sites will increase the total surface abundance of a particle species (“normal” and strong sites) for surface temperatures above the desorption temperature associated with the “normal” binding sites. For species that have a desorption temperature well above the grain temperature of interest, the rate will only be marginally affected. The inhomogeneity of the grain surface can therefore be approximated by only including extra “strong-site species” for the surface species that have a desorption temperature below the grain surface temperature of interest. In the case of a dynamical model, in which the grain temperature changes, the chemical model should fulfil this condition for the entire temperature range.
All Figures
|
Fig. 1 Molecular hydrogen formation efficiency as a function of temperature for only type 0 sites (circles), α = 0.4 (squares) and α = 1.0 (diamonds). |
| In the text | |
|
Fig. 2 Molecular hydrogen formation efficiency as a function of grain size for (top) α = 0.4 and (bottom) α = 1.0. Monte Carlo results are indicated with circles (10 K), squares (12 K), diamonds (14 K) and crosses (15 K), solid and dashed lines represent the classical and modified rate equation results, respectively. In the bottom panel, the 10, 12, and 14 K (modified) rate equations results overlap. |
| In the text | |
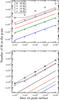 |
Fig. 3 Similar to Fig. 2 for the number of H atoms on the grain. |
| In the text | |
|
Fig. 4 Molecular hydrogen formation efficiency as a function of the fraction of type 1 sites for 10, 12, 14, and 16 K and (top) α = 0.4 and (bottom) α = 1.0. Symbols similar to Fig. 2. |
| In the text | |
|
Fig. 5 Molecular hydrogen formation efficiency for different distribution of sites for (top) α = 0.4 and (bottom) α = 1.0. A fraction of 1% consists of strong binding sites. Symbols similar to Fig. 4. Errors are again within the symbol size and the lines are to guide the eye. |
| In the text | |
Current usage metrics show cumulative count of Article Views (full-text article views including HTML views, PDF and ePub downloads, according to the available data) and Abstracts Views on Vision4Press platform.
Data correspond to usage on the plateform after 2015. The current usage metrics is available 48-96 hours after online publication and is updated daily on week days.
Initial download of the metrics may take a while.