Fig. 6
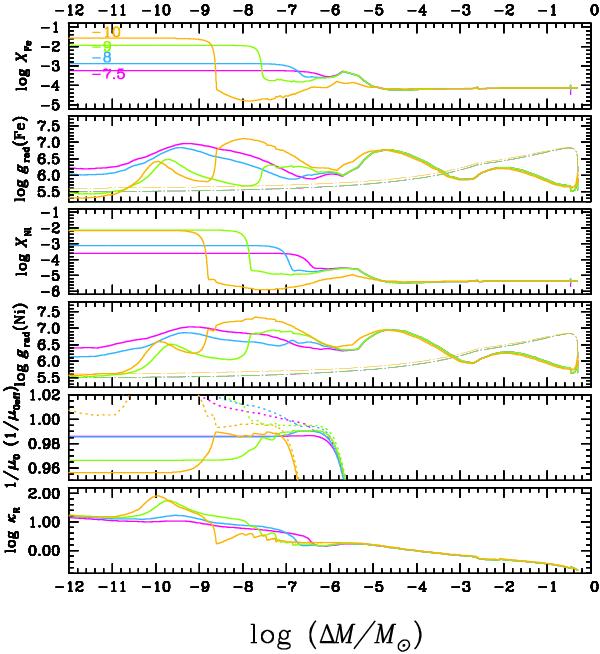
Internal distribution of Fe and Ni together with their relation to grad(Fe) and grad(Ni) in a 0.5 M⊙ model with Z0 = 0.001 for four turbulence strengths, each anchored at a fixed ΔM0 (see Eqs. (1) and (3)), identified in the upper panel. The solutions labeled −7.5, −8 and −9 are after 32 Myr on the HB, while the solution labeled − 10 is after 7 Myr. The lower panel gives κR as a function of log ΔM/M⊙. A local maximum of grad(Fe) and of κR occurs for log ΔM/M⊙ between − 10 and − 9 and corresponds to log T ~ 5.5. When the iron abundance becomes rapidly much higher than solar in contradiction with observations of sdB stars. The function 1/μ0 is shown (solid lines) for each model in the panel above that for κR. In the same panel, the function 1/μ0eff is shown by dotted lines. It is defined in Sect. 5.3.
Current usage metrics show cumulative count of Article Views (full-text article views including HTML views, PDF and ePub downloads, according to the available data) and Abstracts Views on Vision4Press platform.
Data correspond to usage on the plateform after 2015. The current usage metrics is available 48-96 hours after online publication and is updated daily on week days.
Initial download of the metrics may take a while.