Fig. 5
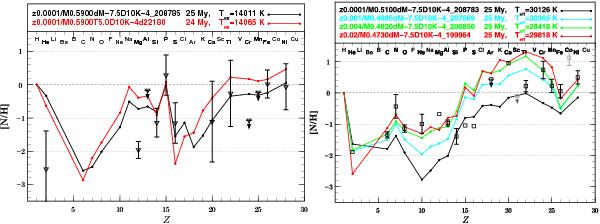
Comparison of surface abundances expected in 14 000 (black line, left panel) and 30 100 K (black line, right panel) HB stars with Z0 = 0.0001, whose interior is shown in Fig. 4. In the left panel, to facilatate a comparison with the turbulence model used by Michaud et al. (2008, see the text for details), the red curve is taken from the left panel of their Fig. 11 and the data for B203 from Behr (2003). In the right panel the other curves correspond to stars of original metallicities of Z0 = 0.001, 0.004, and 0.02 and the data for Feige 48 are from O’Toole & Heber (2006). Gray is used for data points of atomic species, which are not included in our calculations because they are not in OPAL opacities.
Current usage metrics show cumulative count of Article Views (full-text article views including HTML views, PDF and ePub downloads, according to the available data) and Abstracts Views on Vision4Press platform.
Data correspond to usage on the plateform after 2015. The current usage metrics is available 48-96 hours after online publication and is updated daily on week days.
Initial download of the metrics may take a while.