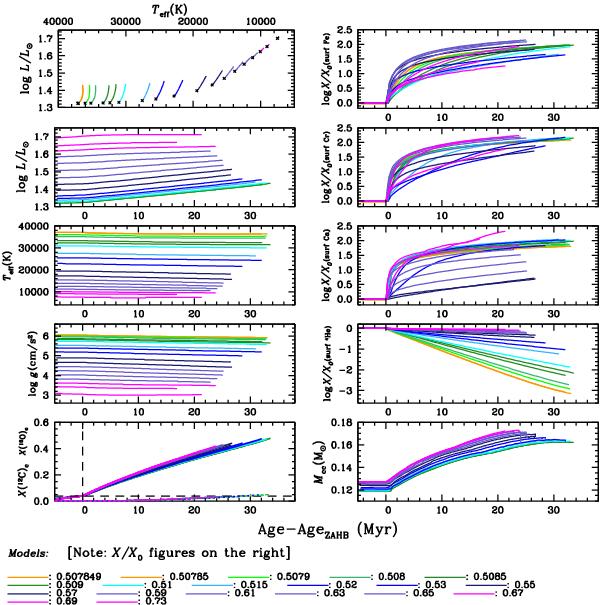
Fig. B.1

Models with Z0 = 0.0001. The curves are identified in the figure by the mass of the HB model. The color code is the same as used for the left panel of Fig. 2 and is defined in footnote [5]. Zero age HB is defined as the moment when X(12C) reaches 0.04. In the figures the curves are not all very precisely aligned to that value. X0(surfFe) identifies the Fe mass fraction in the original main-sequence model, similarly for the other species.
Current usage metrics show cumulative count of Article Views (full-text article views including HTML views, PDF and ePub downloads, according to the available data) and Abstracts Views on Vision4Press platform.
Data correspond to usage on the plateform after 2015. The current usage metrics is available 48-96 hours after online publication and is updated daily on week days.
Initial download of the metrics may take a while.


