Fig. 15
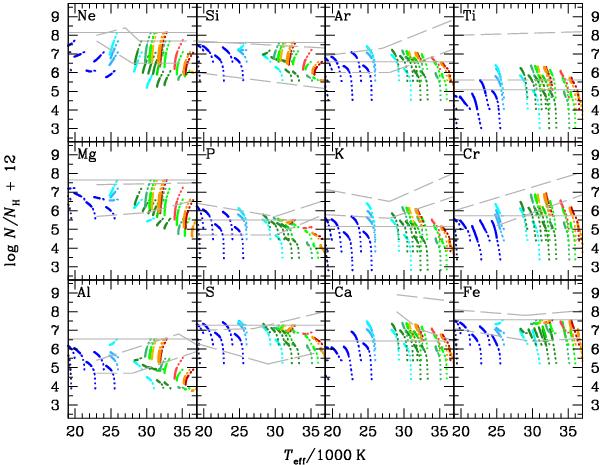
Surface abundances for atomic species from Ne to Fe. Iron is also in Fig. 14 where is found a detailed caption. The domain of observed values is bounded by long dashed broken gray lines which are also shown for Fe in Fig. 14. The domain of abundances often extends below the lower curve because many measurements are upper limits (see Geier et al. 2008, 2010). The solid horizontal gray line is the solar abundance. Note that individual panels span 7 orders of magnitude in abundances.
Current usage metrics show cumulative count of Article Views (full-text article views including HTML views, PDF and ePub downloads, according to the available data) and Abstracts Views on Vision4Press platform.
Data correspond to usage on the plateform after 2015. The current usage metrics is available 48-96 hours after online publication and is updated daily on week days.
Initial download of the metrics may take a while.