Fig. 14
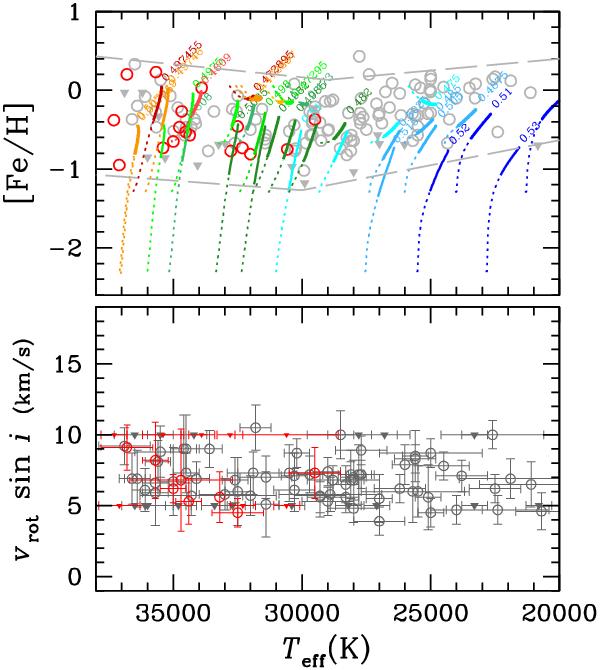
Surface concentrations of Fe as a function of Teff in sdB stars. Models were calculated with original concentrations of [Fe/H] = −2.3, −1.3, −0.4 and 0.0. Models span the Teff interval from 20 000 to 37 000 K and the mass interval from 0.47 to 0.52 M⊙. The lines give the surface abundance variation for each calculated model. They are color-coded as a function of the mass of the model, which may be read by zooming on the figure in the electronic version; solid lines for the time interval from 10 to 32 Myr after ZAHB and dotted from 0 to 10 Myr. The dotted line starts at the original abundance of the model. For most models the spanned time interval is approximately 32 Myr. Note that most models starting with a solar metallicity have very short tracks. Observations (circles) are from Geier et al. (2008), Geier et al. (2010) and Geier (2010, priv. commun.). Inverted triangles are upper limits. The stars in red in Fig. 2 are also in red in this figure. The bottom part of the figure gives the rotation velocities and the error bars on Teff.
Current usage metrics show cumulative count of Article Views (full-text article views including HTML views, PDF and ePub downloads, according to the available data) and Abstracts Views on Vision4Press platform.
Data correspond to usage on the plateform after 2015. The current usage metrics is available 48-96 hours after online publication and is updated daily on week days.
Initial download of the metrics may take a while.