Fig. 12
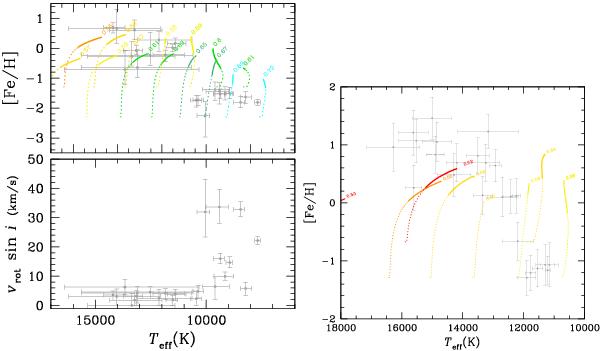
Left panel: surface concentration of Fe as a function of Teff in clusters (M 3, M 13 NGC 288) from Behr (2003) with original Fe concentration between − 2.3 and − 1.3 dex the solar one. Models are shown for those two metallicities. Each color-coded segment represents the evolution of the surface Fe concentration. The line is solid for the time interval from 10 to 30 Myr after ZAHB, but dotted from 0 to 10 Myr. Right panel: surface concentrations of Fe as a function of Teff in the cluster NGC 2808 from Pace et al. (2006). The color-coding is defined in footnote (5). For most models the spanned time interval is approximately 30 Myr.
Current usage metrics show cumulative count of Article Views (full-text article views including HTML views, PDF and ePub downloads, according to the available data) and Abstracts Views on Vision4Press platform.
Data correspond to usage on the plateform after 2015. The current usage metrics is available 48-96 hours after online publication and is updated daily on week days.
Initial download of the metrics may take a while.