Fig. 11

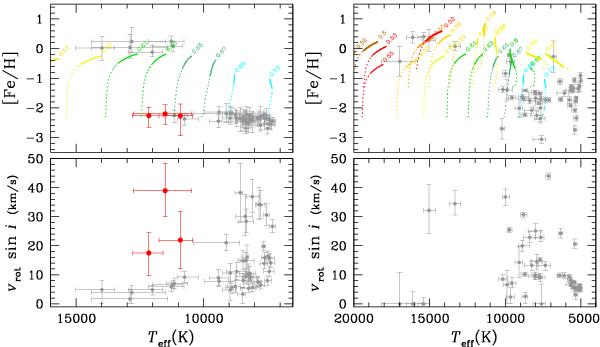
Left panel: surface concentration of Fe as a function of Teff in clusters (M 15, M 68 and M 92) from Behr (2003) with original Fe concentration ~ −2.3. Models are shown for this metallicity. Each color-coded segment represents the evolution of the surface Fe concentration. The line is solid for the time interval from 10 to 30 Myr after ZAHB, but dotted from 0 to 10 Myr. Bottom part: rotation velocities; three stars have their rotation velocities and [Fe/H] in red to facilitate their identification. Right panel: field stars also from Behr (2003). The distribution of metallicity for the cooler field stars gives an indication of the original metallicity distribution for the hotter field stars as well as for sdBs.
Current usage metrics show cumulative count of Article Views (full-text article views including HTML views, PDF and ePub downloads, according to the available data) and Abstracts Views on Vision4Press platform.
Data correspond to usage on the plateform after 2015. The current usage metrics is available 48-96 hours after online publication and is updated daily on week days.
Initial download of the metrics may take a while.


