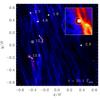
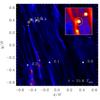
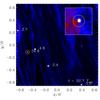
Fig. 6
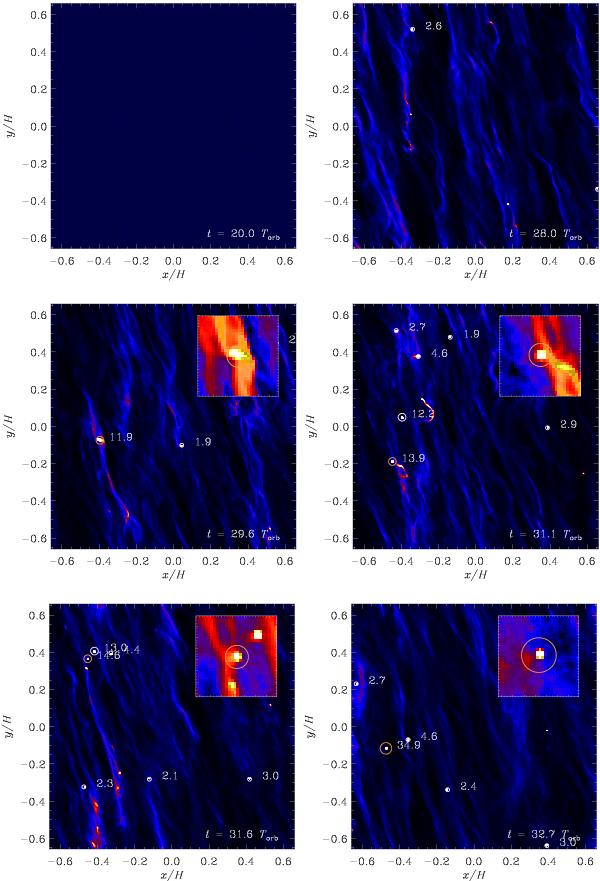
The particle column density as a function of time after self-gravity is turned on at t = 20.0 Torb, for run M2 (2563 grid cells with 8 × 10⁶ particles). Each gravitationally bound clump is labelled by its Hill mass in units of Ceres masses. The insert shows an enlargement of the region around the most massive bound clump. The most massive clump at the end of the simulation contains a total particle mass of 34.9 Ceres masses, partially as the result of a collision between a 13.0 and a 14.6 Ceres mass clump occurring at a time around t = 31.6 Torb.
Current usage metrics show cumulative count of Article Views (full-text article views including HTML views, PDF and ePub downloads, according to the available data) and Abstracts Views on Vision4Press platform.
Data correspond to usage on the plateform after 2015. The current usage metrics is available 48-96 hours after online publication and is updated daily on week days.
Initial download of the metrics may take a while.