Fig. 5
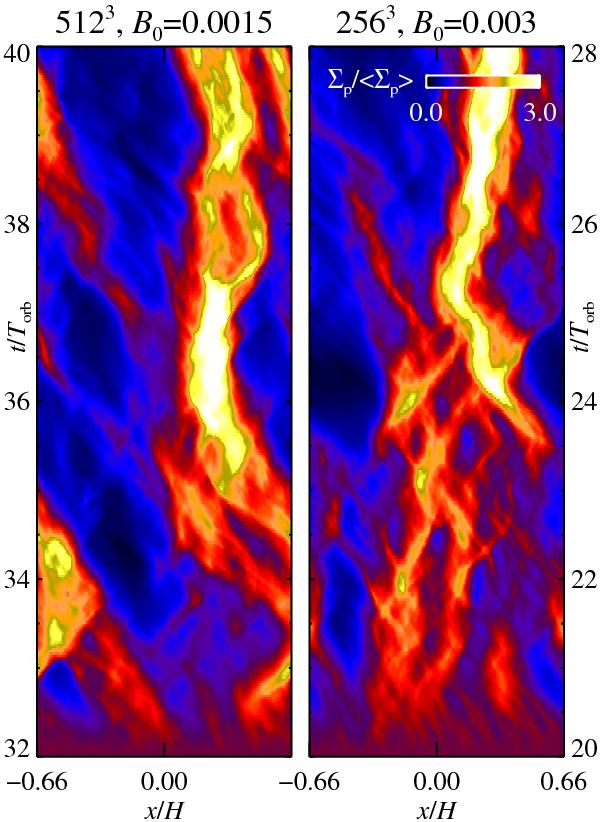
The particle column density averaged over the azimuthal direction, as a function of radial coordinate x and time t in orbits. The starting time was chosen to be slightly prior to the emergence of a pressure bump (compare with left-most and right-most plots of Fig. 4). The particles concentrate slightly downstream of the gas pressure bump, with a maximum column density between three and four times the mean particle column density. The particles are between 40 and 80 cm in radius (i.e. boulders) for our adopted disc model.
Current usage metrics show cumulative count of Article Views (full-text article views including HTML views, PDF and ePub downloads, according to the available data) and Abstracts Views on Vision4Press platform.
Data correspond to usage on the plateform after 2015. The current usage metrics is available 48-96 hours after online publication and is updated daily on week days.
Initial download of the metrics may take a while.