Fig. 7
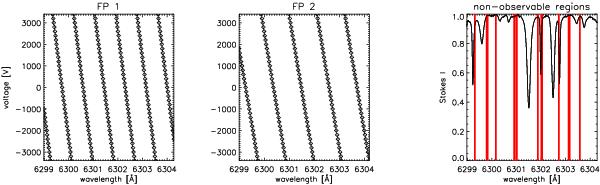
Calibration functions V(λ) for FPI1 (left panel) and FPI2 (middle panel) recorded on April 17, 2010 for the eo-axis. Linear functions (solid lines) are fitted through the measurement points (diamonds). Since the voltages cannot be tuned beyond 3500 V, there are wavelengths that cannot be set by voltage tuning in the eo-configuration (right panel, shaded areas).
Current usage metrics show cumulative count of Article Views (full-text article views including HTML views, PDF and ePub downloads, according to the available data) and Abstracts Views on Vision4Press platform.
Data correspond to usage on the plateform after 2015. The current usage metrics is available 48-96 hours after online publication and is updated daily on week days.
Initial download of the metrics may take a while.