Fig. B.1
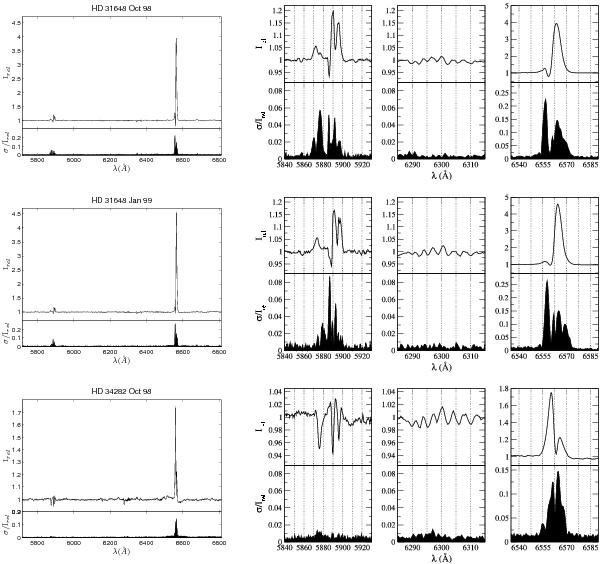
For each star and observing campaign, the mean spectra and relative variability distributions are plotted on the left side. The HeI5876, NaID, [OI]6300 and Hα regions are enlarged on the right side, for a better visualization. The mean spectrum is given by  Ii,k, and the relative variability by σk/Irel,k, being σk = [
 (Ii,k − Irel,k)2]1/2. The subindex k refers to each spectral bin and the subindex i to each one of the N spectra per observing campaign. The relative variability plots provide information on the strength and wavelength position of the changes in the line intensity (Johns & Basri 1995).
Current usage metrics show cumulative count of Article Views (full-text article views including HTML views, PDF and ePub downloads, according to the available data) and Abstracts Views on Vision4Press platform.
Data correspond to usage on the plateform after 2015. The current usage metrics is available 48-96 hours after online publication and is updated daily on week days.
Initial download of the metrics may take a while.